Copyright
©The Author(s) 2018.
World J Gastroenterol. Jul 28, 2018; 24(28): 3120-3129
Published online Jul 28, 2018. doi: 10.3748/wjg.v24.i28.3120
Published online Jul 28, 2018. doi: 10.3748/wjg.v24.i28.3120
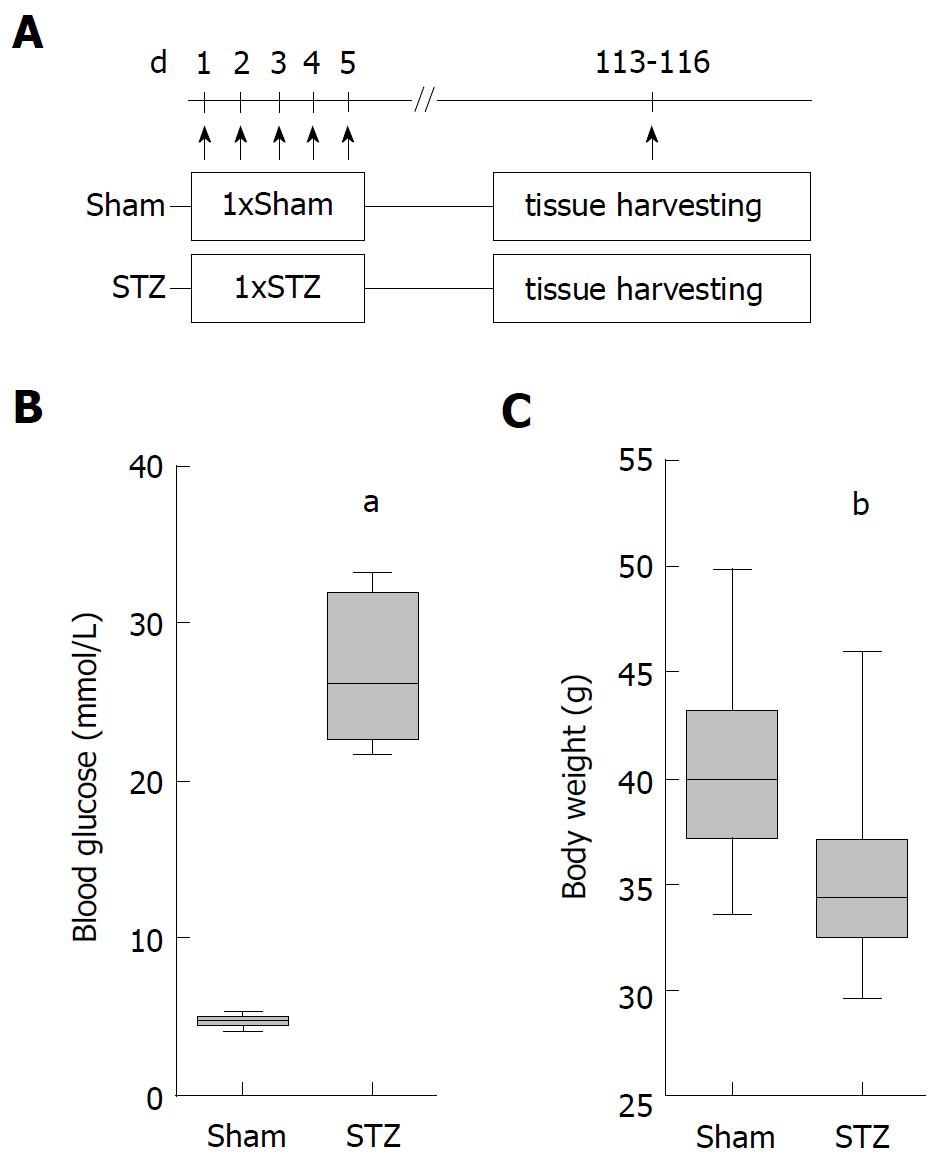
Figure 1 Experimental protocol of the hyperglycemic autoimmune pancreatitis model.
28-40 wk old- MRL/MpJ mice were intraperitoneally (ip) injected with streptozotocin on day 1-5 (group: STZ), while one age-matched control cohort was ip injected with the appropriate vehicle (group: Sham). The tissue was harvested on day 113-116; (A) Treatment with STZ increased the blood glucose concentration; (B) and reduced the body weight on day 113-116; (C) Box plots indicate the median, the 25th and 75th percentiles in the form of a box, and the 10th and 90th percentiles as whiskers. The number of animals evaluated was n = 19 (Sham) and n = 17 (STZ). Differences between the indicated cohorts are indicated as significant. aP < 0.001; bP = 0.009. STZ: Streptozotocin-treated.
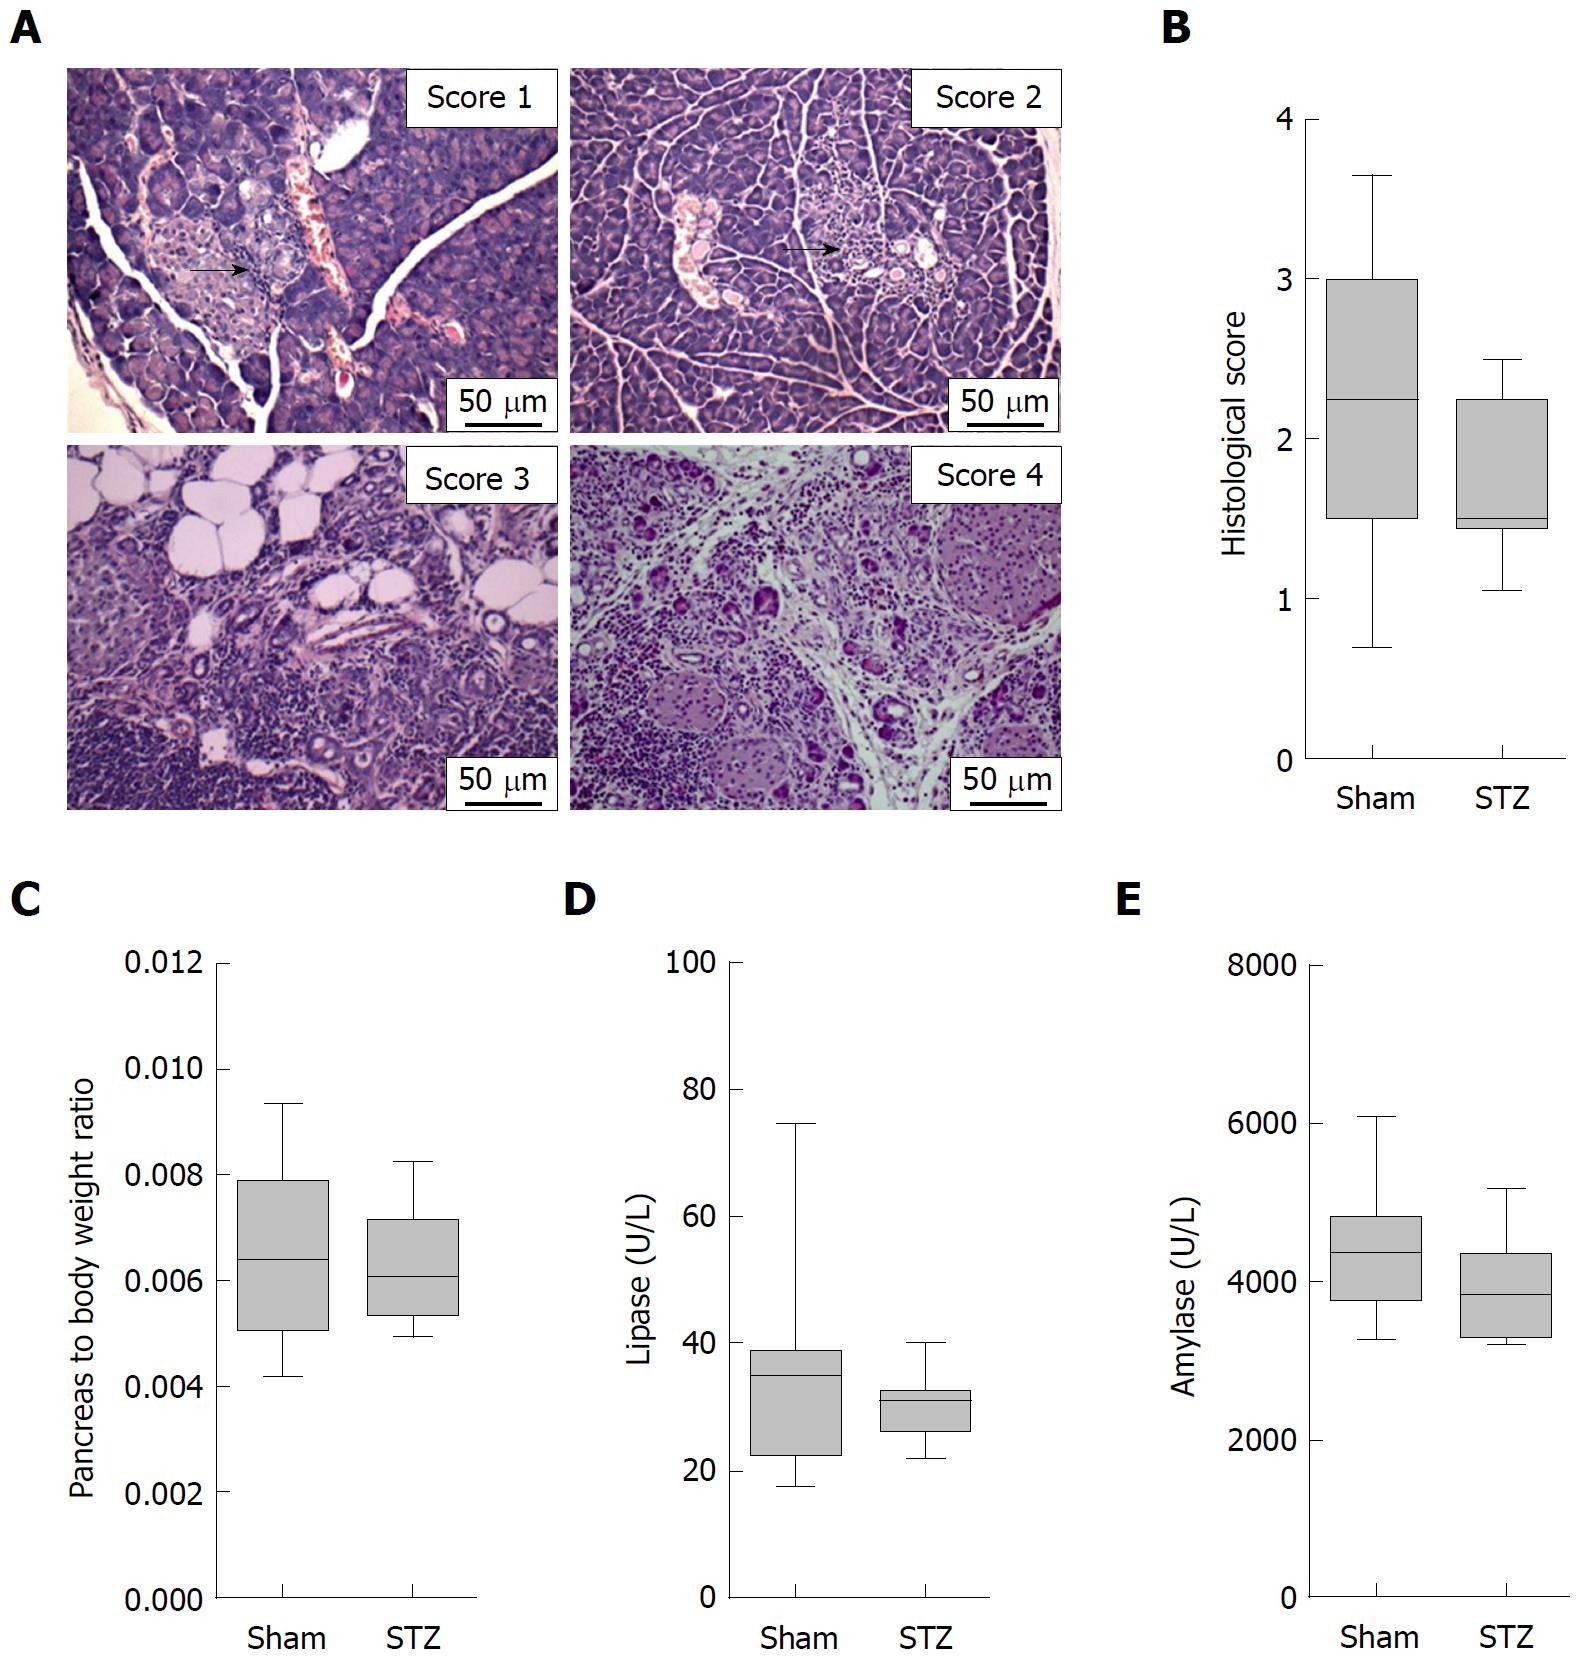
Figure 2 Evaluation of autoimmune pancreatitis.
A: Representative images of the histological scores of autoimmune pancreatitis. Arrows point at small inflammatory infiltrates embedded in healthy surrounding tissue; B: hyperglycemia (STZ) reduced the histological score slightly compared to normoglycemic controls (sham); little differences are observed in the pancreas to body weight ratio (C), lipase activity (D), and amylase activity (E). The number of animals evaluated was n = 19 (sham) and n = 17 (STZ) in Panel B and C and n = 19 (Sham) and n = 15 (STZ) in D and E. Scale bar = 50 μm. STZ: Streptozotocin-treated.
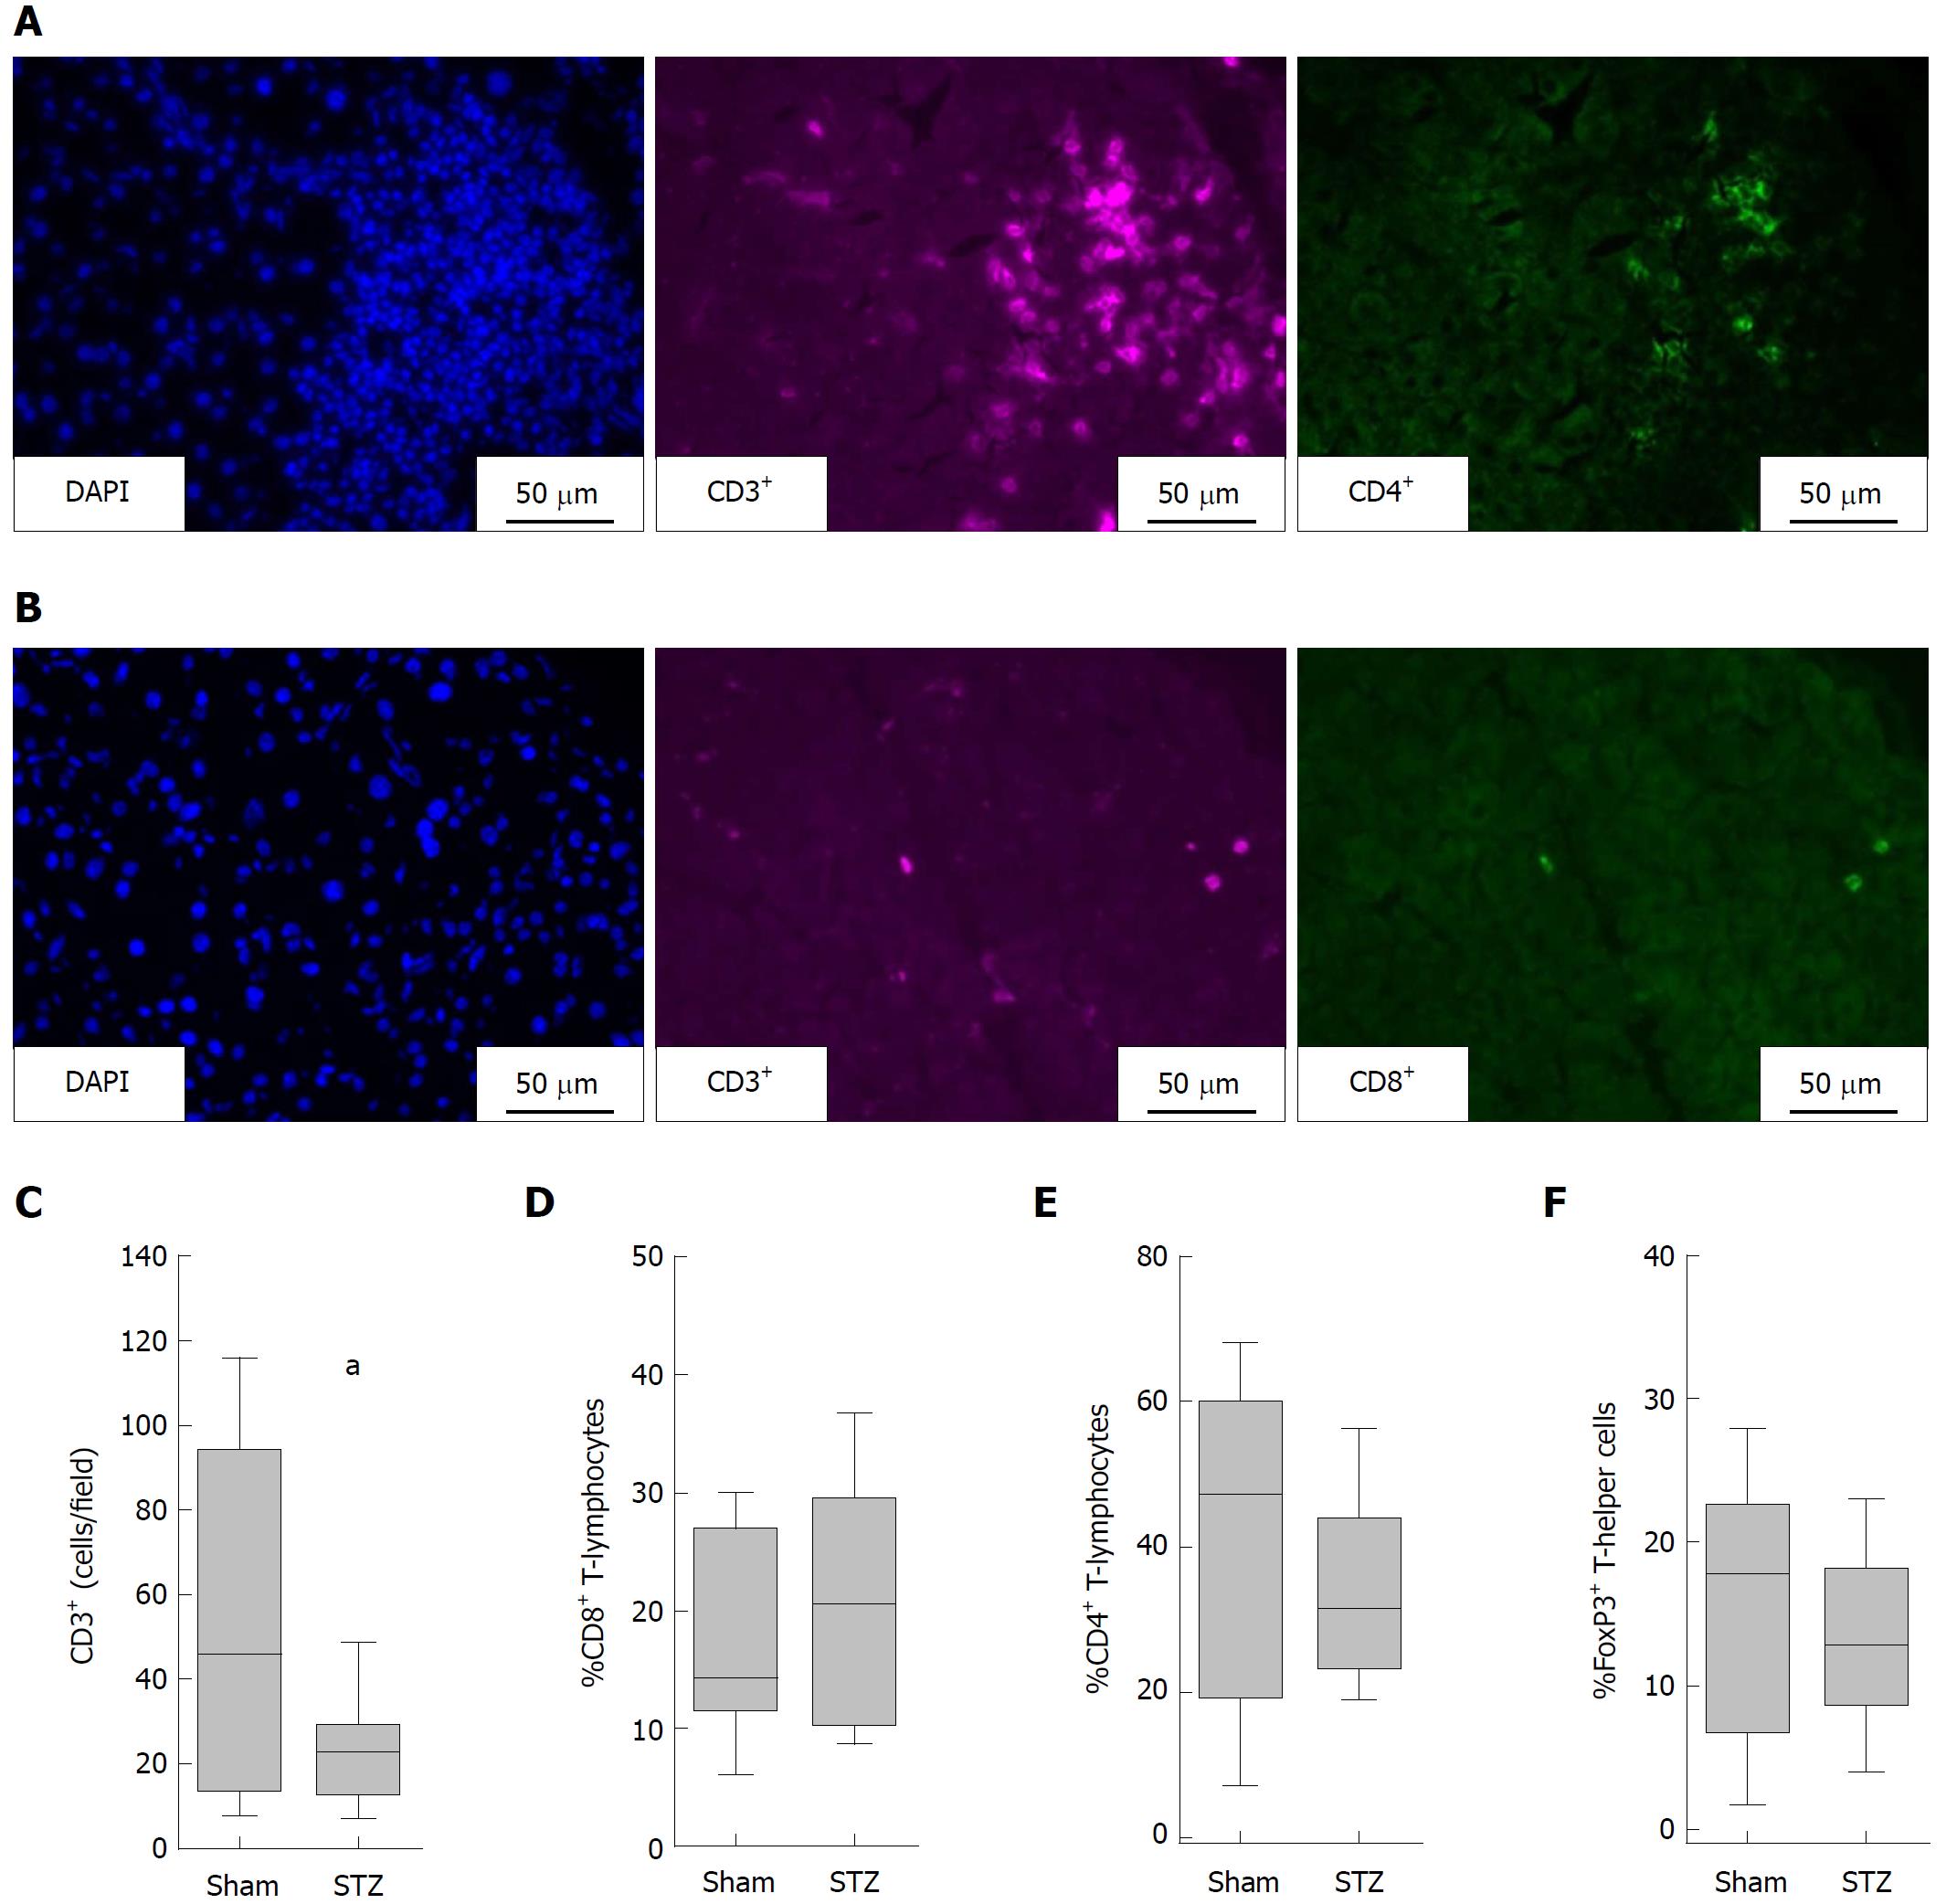
Figure 3 Evaluation of the local pancreatic inflammation during autoimmune pancreatitis.
Representative images of T-helper cells (CD3+CD4+cells) (A); and cytotoxic T-cells (CD3+CD8+ cells) (B); hyperglycemia induced by STZ decreased the number of T-lymphocytes (defined as number of CD3+ per field) (C); little differences are observed in the percentage of cytotoxic T-lymphocytes (CD8+CD3+ cells × 100 divided by the number of CD3+cells) (D); T-helper cells (CD4+CD3+ cells × 100 divided by the number of CD3+cells) (E); and regulatory T-cells (FoxP3+CD4+cells × 100 divided by the number of CD4+ cells) (F). The number of animals evaluated was n = 19 (Sham) and n = 17 (STZ). Differences between the indicated cohorts are indicated as tendency, aP = 0.053. STZ: Streptozotocin-treated.
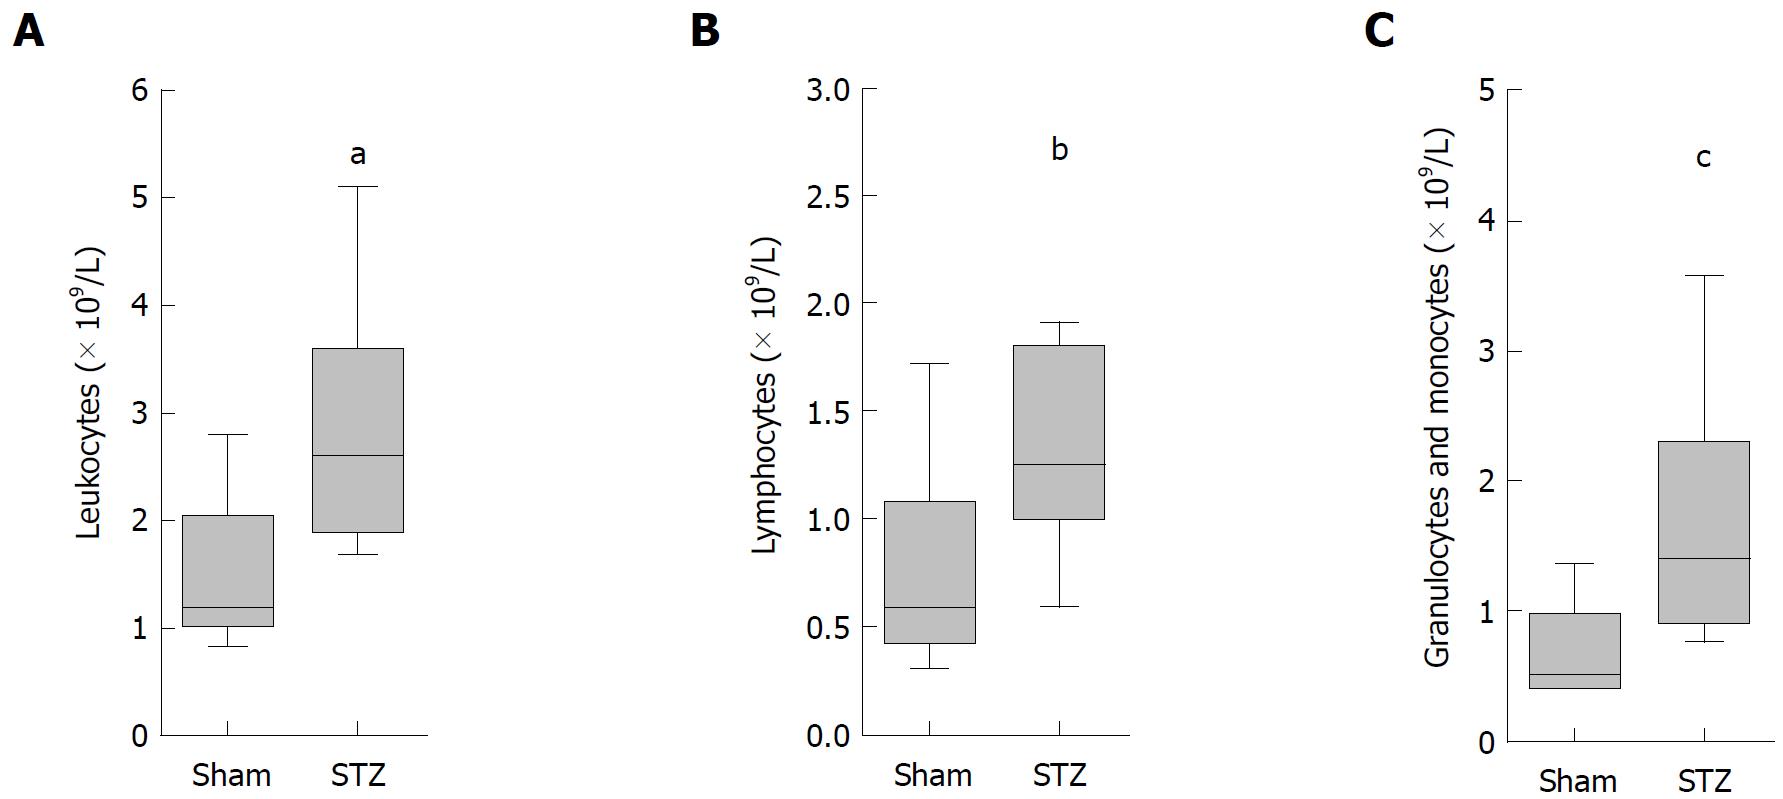
Figure 4 Diabetes increased the number of leukocytes in the blood.
Treatment with STZ raised the number of leukocytes (A); lymphocytes (B); as well as granulocytes and monocytes (C). The number of animals evaluated was n = 19 (Sham) and n = 14 (STZ). Differences between the indicated cohorts are indicated as significant, (A) aP < 0.001; (B) bP = 0.016; (C) cP = 0.001. STZ: Streptozotocin-treated.
Figure 5 Evaluation of leukocytes in the spleen during autoimmune pancreatitis.
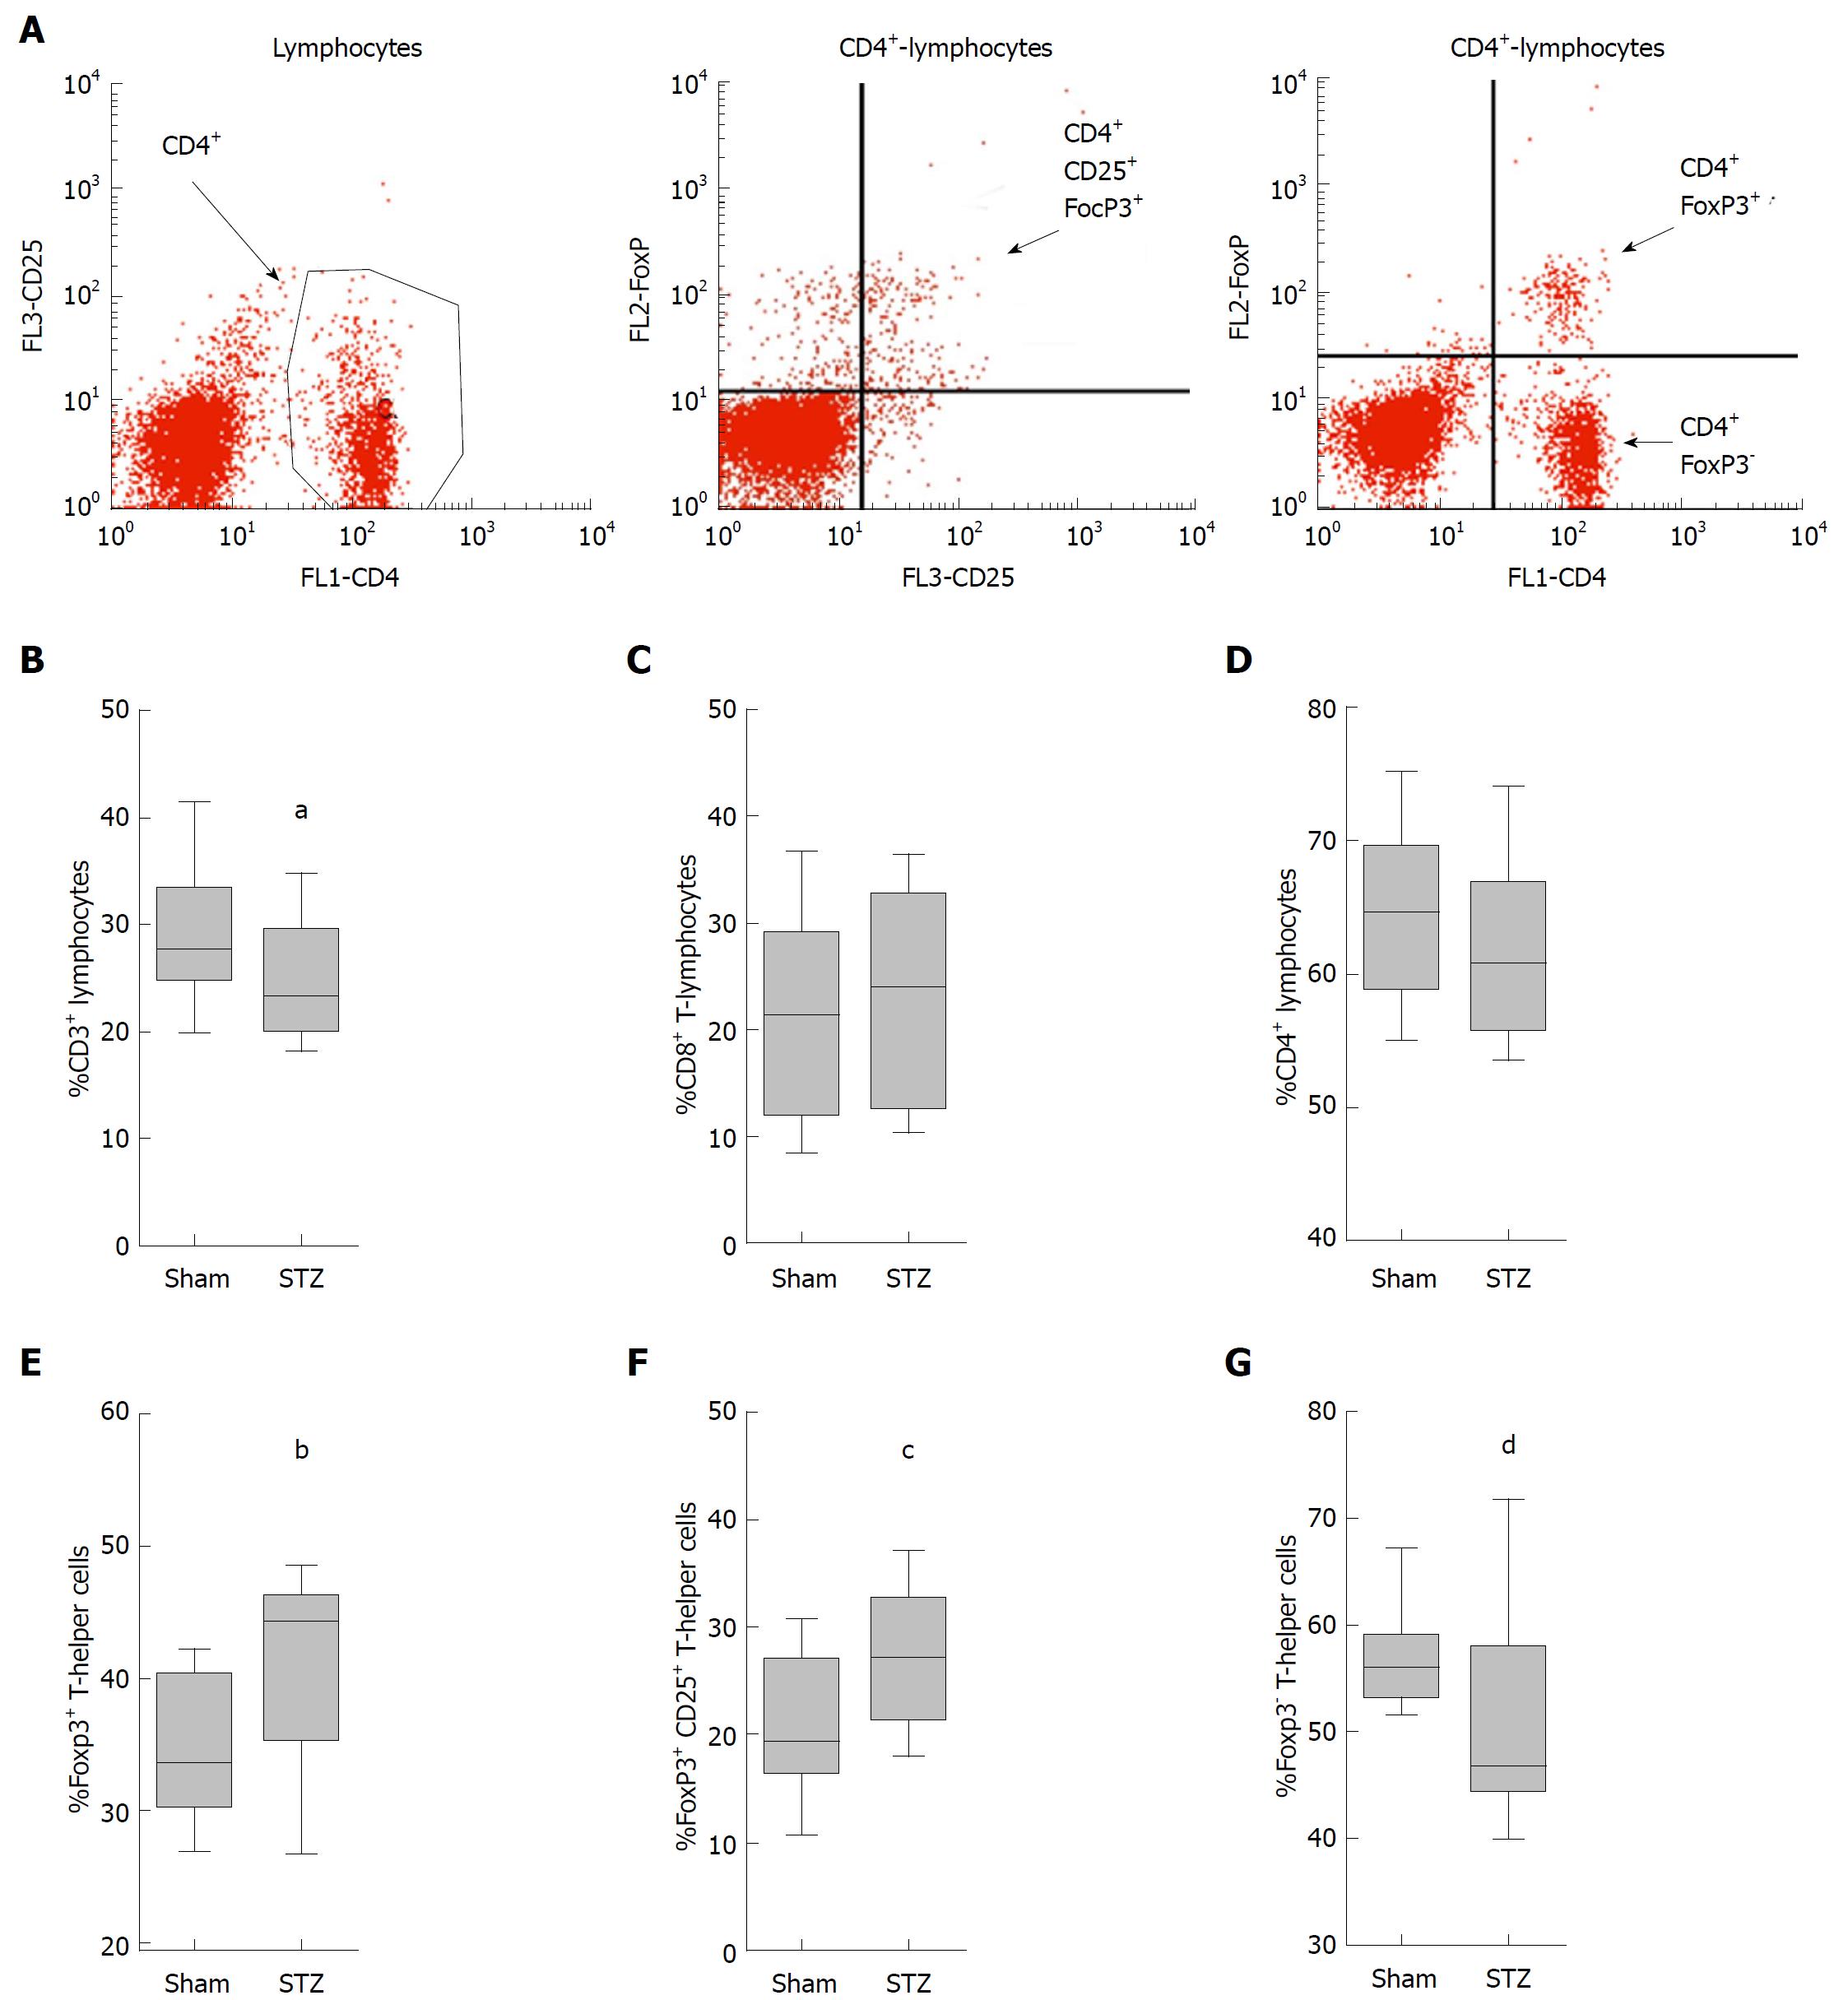
Representative images of stained T-helper cells and their distinction between regulatory T-cells (FoxP3+CD4+ cells), CD25 expressing regulatory T-cells (CD4+CD25+ FoxP3+ cells) and FoxP3- T-cells (FoxP3- CD4+ cells) (A); application of STZ decreased the percentage of T-lymphocytes (defined as number of CD3+ cells × 100 divided by the number of lymphocytes) (B); little differences are observed in the percentage of cytotoxic T-cells (CD8+CD3+ cells × 100 divided by the number of CD3+cells) (C); and T-helper cells (CD4+CD3+ cells × 100 divided by the number of CD3+cells) (D); STZ increased the percentage of regulatory T-cells (FoxP3+CD4+cells × 100 divided by the number of CD4+ cells) (E); and CD25 expressing regulatory T-cells (FoxP3+ CD25+ CD4+ cells × 100 divided by the number of CD4+cells) (F); the percentage of FoxP3- T-cells (FoxP3-CD4+cells × 100 divided by the number of CD4+ cells) was decreased (G). The number of animals evaluated was n = 19 (sham) and n = 17 (STZ). Differences between the indicated cohorts are indicated as tendency, (B) aP = 0.057 or as significant, (E) bP = 0.018; (F) cP = 0.021; (G) dP = 0.034. STZ: Streptozotocin-treated.
- Citation: Müller-Graff FT, Fitzner B, Jaster R, Vollmar B, Zechner D. Impact of hyperglycemia on autoimmune pancreatitis and regulatory T-cells. World J Gastroenterol 2018; 24(28): 3120-3129
- URL: https://www.wjgnet.com/1007-9327/full/v24/i28/3120.htm
- DOI: https://dx.doi.org/10.3748/wjg.v24.i28.3120


