Copyright
©The Author(s) 2017.
World J Gastroenterol. Sep 7, 2017; 23(33): 6077-6087
Published online Sep 7, 2017. doi: 10.3748/wjg.v23.i33.6077
Published online Sep 7, 2017. doi: 10.3748/wjg.v23.i33.6077
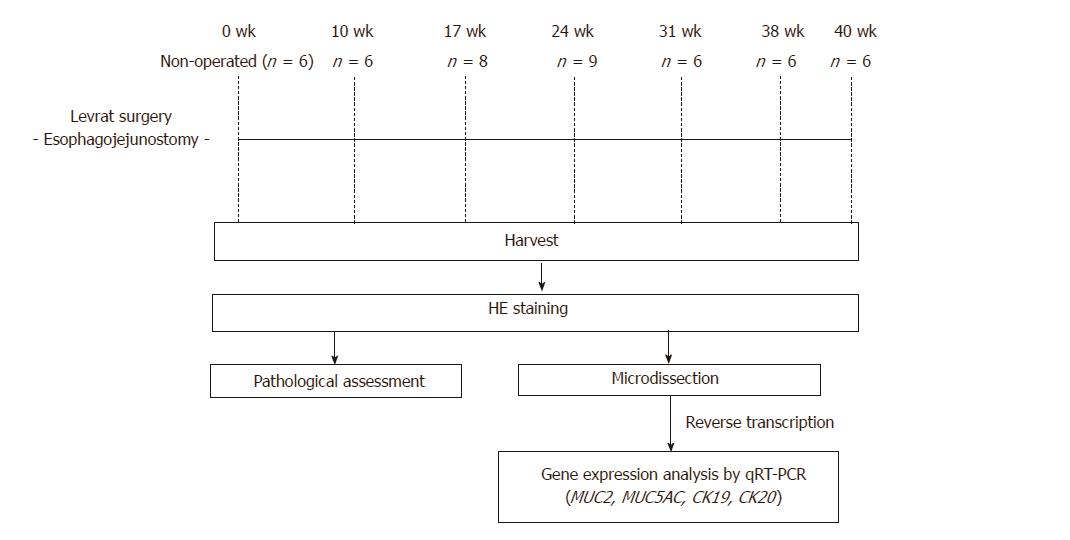
Figure 1 Study schema representing the major steps in the experimental design.
qRT-PCR: Quantitative reverse transcription-polymerase chain reaction.
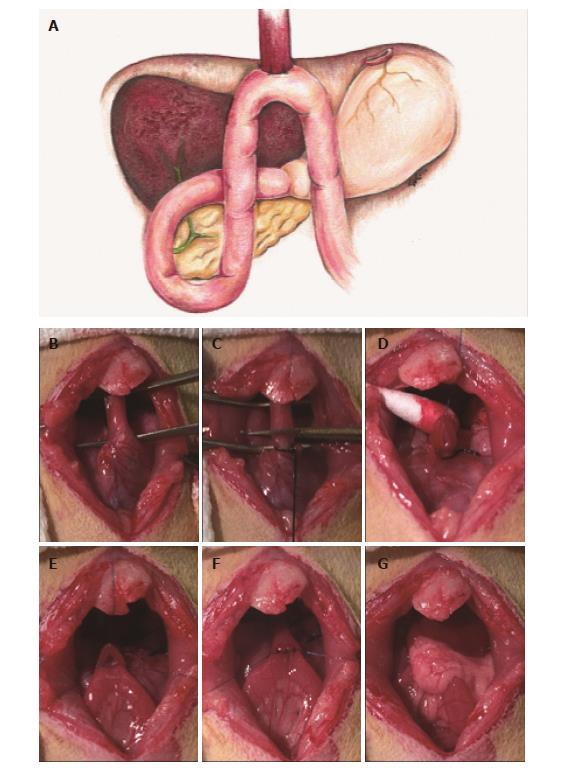
Figure 2 Diagram of modified Levrat model and images of the main steps of the surgical procedure.
A: Illustration of end-to-side esophagojejunostomy with gastric preservation; B: Esophagus is mobilized, preserving the left and right vagus nerves; C: Esophagus divided from the stomach after ligation of gastroesophageal junction; D: Anterior esophageal suture placed through muscle and mucosa layers, allowing proper visualization of mucosa; E: Anterior and lateral esophageal sutures intact, creating visualization of the lumen; F: Completed anastomosis between the distal esophagus and jejunum with eight interrupted full-thickness sutures; G: Anastomosis returned to anatomical location wrapped in omentum.
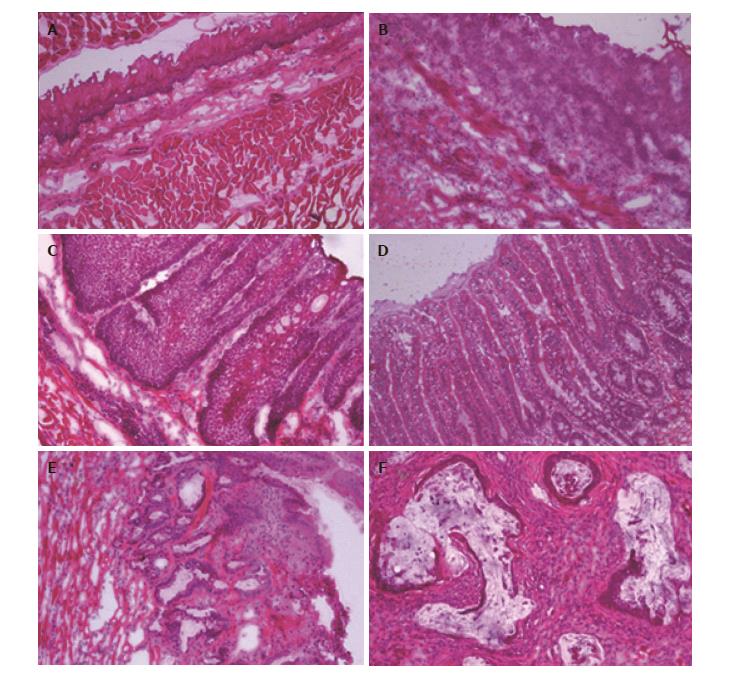
Figure 3 HE staining of esophageal disease progression (× 10).
A: Normal rat esophagus; B: Esophagitis; C: BE with goblet cells; D: Dysplasia; E: EAC. EAC: Esophageal adenocarcinoma; BE: Barrett’s esophagus.
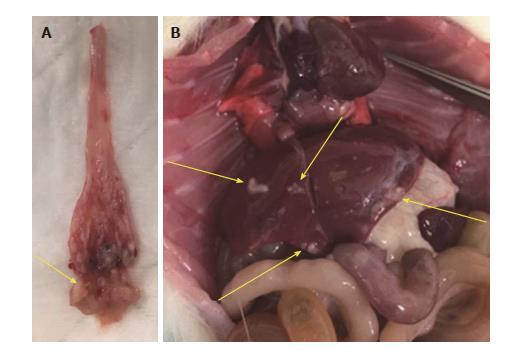
Figure 4 Primary esophageal adenocarcinoma tumor (A) and respective liver metastasis (B), as grossly observed in a 40-wk post-surgical rat.
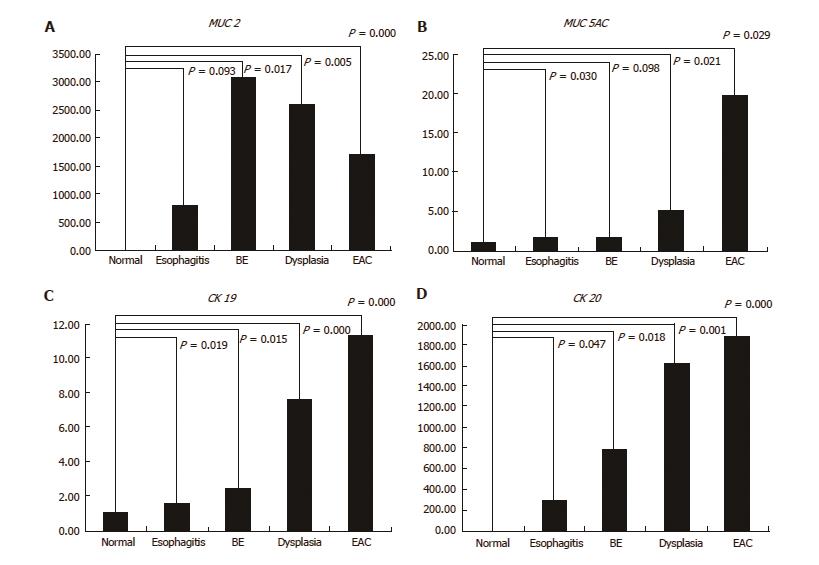
Figure 5 Panel A to D represents the relative gene expression level of MUC2, MUC5AC, CK19, and CK20 for each esophageal disease level, respectively.
BE: Barrett’s esophagus; EAC: esophageal adenocarcinoma.
- Citation: Matsui D, Omstead AN, Kosovec JE, Komatsu Y, Lloyd EJ, Raphael H, Kelly RJ, Zaidi AH, Jobe BA. High yield reproducible rat model recapitulating human Barrett’s carcinogenesis. World J Gastroenterol 2017; 23(33): 6077-6087
- URL: https://www.wjgnet.com/1007-9327/full/v23/i33/6077.htm
- DOI: https://dx.doi.org/10.3748/wjg.v23.i33.6077


