Copyright
©The Author(s) 2017.
World J Gastroenterol. Jun 21, 2017; 23(23): 4191-4199
Published online Jun 21, 2017. doi: 10.3748/wjg.v23.i23.4191
Published online Jun 21, 2017. doi: 10.3748/wjg.v23.i23.4191
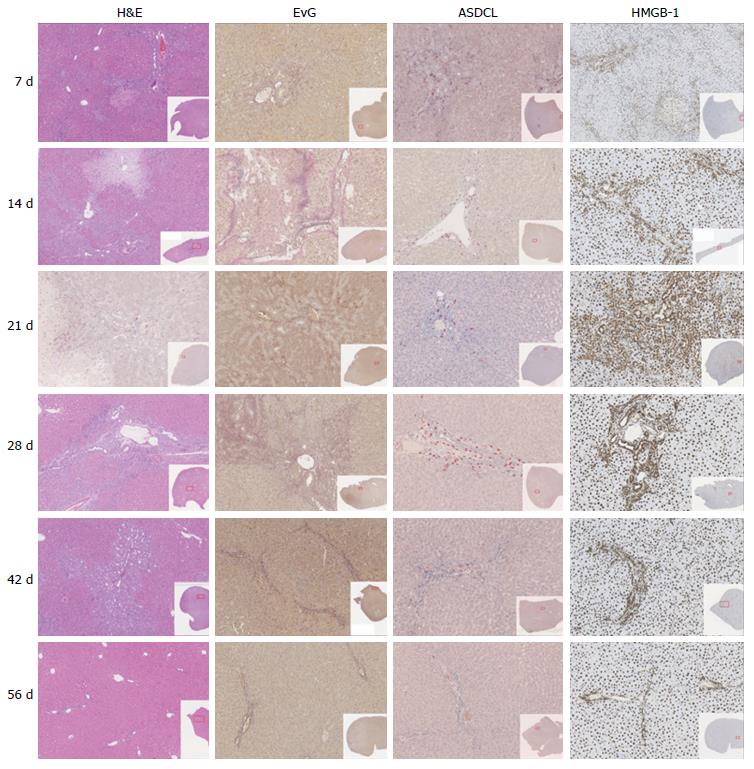
Figure 1 Graphics of histologic sections (H&E, EvG, ASDCL, HMGB-1), divided by group.
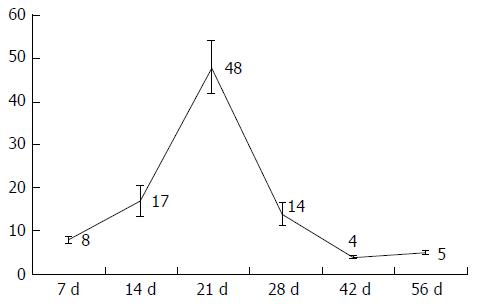
Figure 2 Bile duct quantification, mean bile ducts per portal field + standard deviations, divided by group.
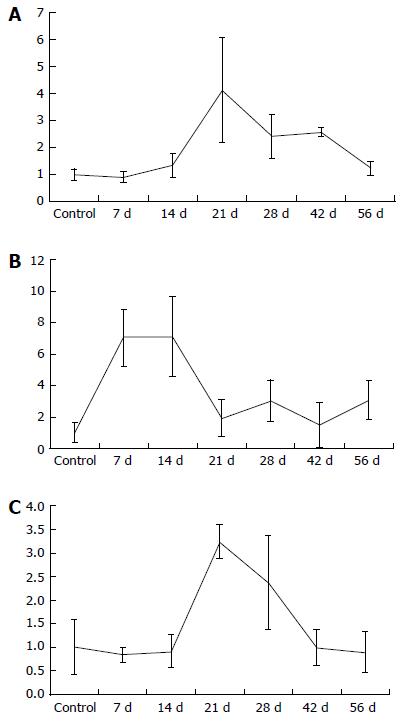
Figure 3 Mean laboratory, mean + SD of IL-33 (A), p-21 (B) and GADD45a (C) mRNA, divided by group.
- Citation: Dondorf F, Fahrner R, Ardelt M, Patsenker E, Stickel F, Dahmen U, Settmacher U, Rauchfuß F. Induction of chronic cholestasis without liver cirrhosis - Creation of an animal model. World J Gastroenterol 2017; 23(23): 4191-4199
- URL: https://www.wjgnet.com/1007-9327/full/v23/i23/4191.htm
- DOI: https://dx.doi.org/10.3748/wjg.v23.i23.4191


