Copyright
©The Author(s) 2016.
World J Gastroenterol. Mar 7, 2016; 22(9): 2818-2827
Published online Mar 7, 2016. doi: 10.3748/wjg.v22.i9.2818
Published online Mar 7, 2016. doi: 10.3748/wjg.v22.i9.2818
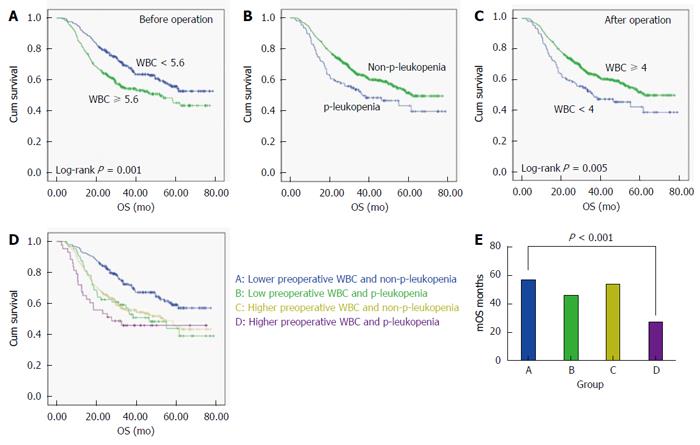
Figure 1 Kaplan-Meier curves depicting overall survival.
A: Patients with higher preoperative white blood cell count (WBC) had shorter overall survival (OS) when divided by the median; B: Patients affected by p-leukopenia had worse OS; C: Patients whose WBC < 4.0 × 10⁹/L after surgery had lower OS than those whose WBC ≥ 4.0 × 10⁹/L; D: Combined analysis of OS by pre- and postoperative WBC. Patients with low preoperative WBC but without p-leukopenia showed the optimal OS, significantly longer than that in patients who had both high preoperative WBC and p-leukopenia.
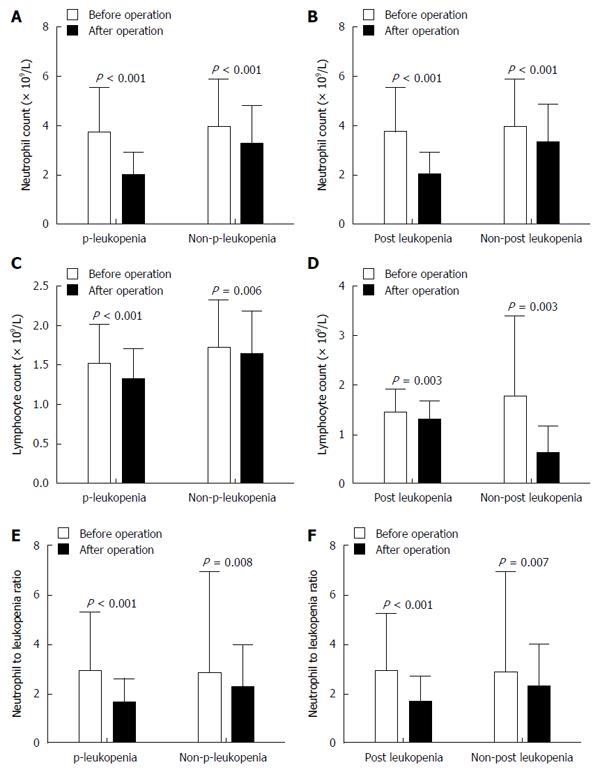
Figure 2 Neutrophil count (A, B), lymphocyte count (C, D), and neutrophil to lymphocyte ratio (E, F) in patients with and without p-leukopenia or postoperative leukopenia before and after surgery.
P-leukopenia refers to preoperative WBC ≥ 4.0 × 10⁹/L and postoperative WBC < 4.0 × 10⁹/L, with an absolute decrease ≥ 0.5 × 10⁹/L WBC. Postoperative leukopenia (Post leukopenia) here was defined as WBC < 4.0 × 10⁹/L. Data was presented as mean ± SD. P values were determined by Student’s t test compared with the corresponding values before operation. WBC: White blood cell.
- Citation: Chen XF, Qian J, Pei D, Zhou C, Røe OD, Zhu F, He SH, Qian YY, Zhou Y, Xu J, Xu J, Li X, Ping GQ, Liu YQ, Wang P, Guo RH, Shu YQ. Prognostic value of perioperative leukocyte count in resectable gastric cancer. World J Gastroenterol 2016; 22(9): 2818-2827
- URL: https://www.wjgnet.com/1007-9327/full/v22/i9/2818.htm
- DOI: https://dx.doi.org/10.3748/wjg.v22.i9.2818


