Copyright
©The Author(s) 2016.
World J Gastroenterol. Jul 14, 2016; 22(26): 6049-6056
Published online Jul 14, 2016. doi: 10.3748/wjg.v22.i26.6049
Published online Jul 14, 2016. doi: 10.3748/wjg.v22.i26.6049
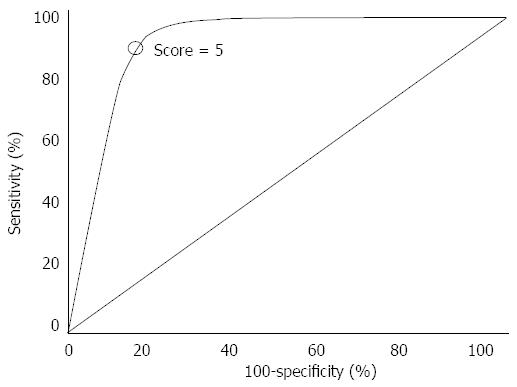
Figure 1 Receiver operating characteristic curve analysis aimed at identifying the cut-off point for the score.
Receiver operating characteristic curve analysis identified the value 5 as the more sensitive and specific cut-off point for the recurrence score.
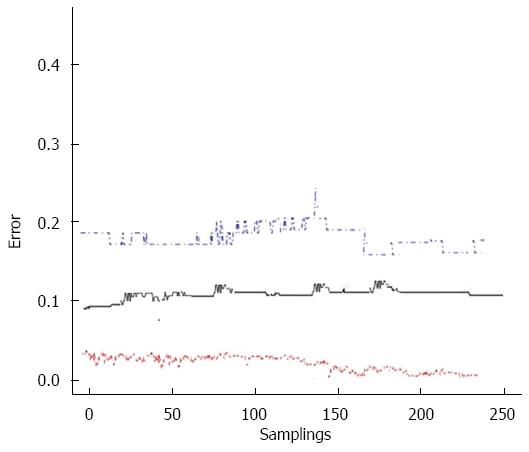
Figure 2 Ten-fold cross validation error rate.
The overall average error rate was 0.12. Red line indicates error rate for recurrence prediction, blue line indicates error rate for non-recurrence prediction, black line the average error rate.
- Citation: Facciorusso A, Di Maso M, Serviddio G, Vendemiale G, Muscatiello N. Development and validation of a risk score for advanced colorectal adenoma recurrence after endoscopic resection. World J Gastroenterol 2016; 22(26): 6049-6056
- URL: https://www.wjgnet.com/1007-9327/full/v22/i26/6049.htm
- DOI: https://dx.doi.org/10.3748/wjg.v22.i26.6049


