Copyright
©The Author(s) 2015.
World J Gastroenterol. Feb 28, 2015; 21(8): 2358-2366
Published online Feb 28, 2015. doi: 10.3748/wjg.v21.i8.2358
Published online Feb 28, 2015. doi: 10.3748/wjg.v21.i8.2358
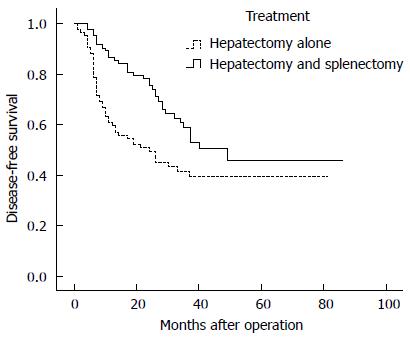
Figure 1 Disease-free survival rates of patients in the two groups.
The 1-, 3-, 5-, and 7-year disease-free survival rates for the hepatectomy and splenectomy group were 86.7%, 70.9%, 52.7%, and 45.9%, respectively. The 1-, 3-, 5-, and 7-year disease-free survival rates for the hepatectomy alone group were 88.1%, 59.4%, 43.3%, and 39.5%, respectively (P = 0.008).
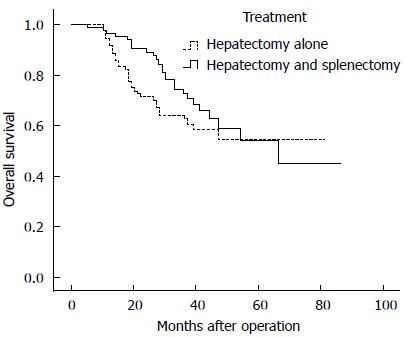
Figure 2 Overall survival rates of patients in the two groups.
The 1-, 3-, 5-, and 7-year overall survival rates for the hepatectomy and splenectomy group were 90.4%, 77.9%, 65.9%, and 45.2%, respectively. The 1-, 3-, 5-, and 7-year overall survival rates for the hepatectomy alone group were 85.7%, 70.0%, 58.3%, and 54.7%, respectively (P = 0.187).
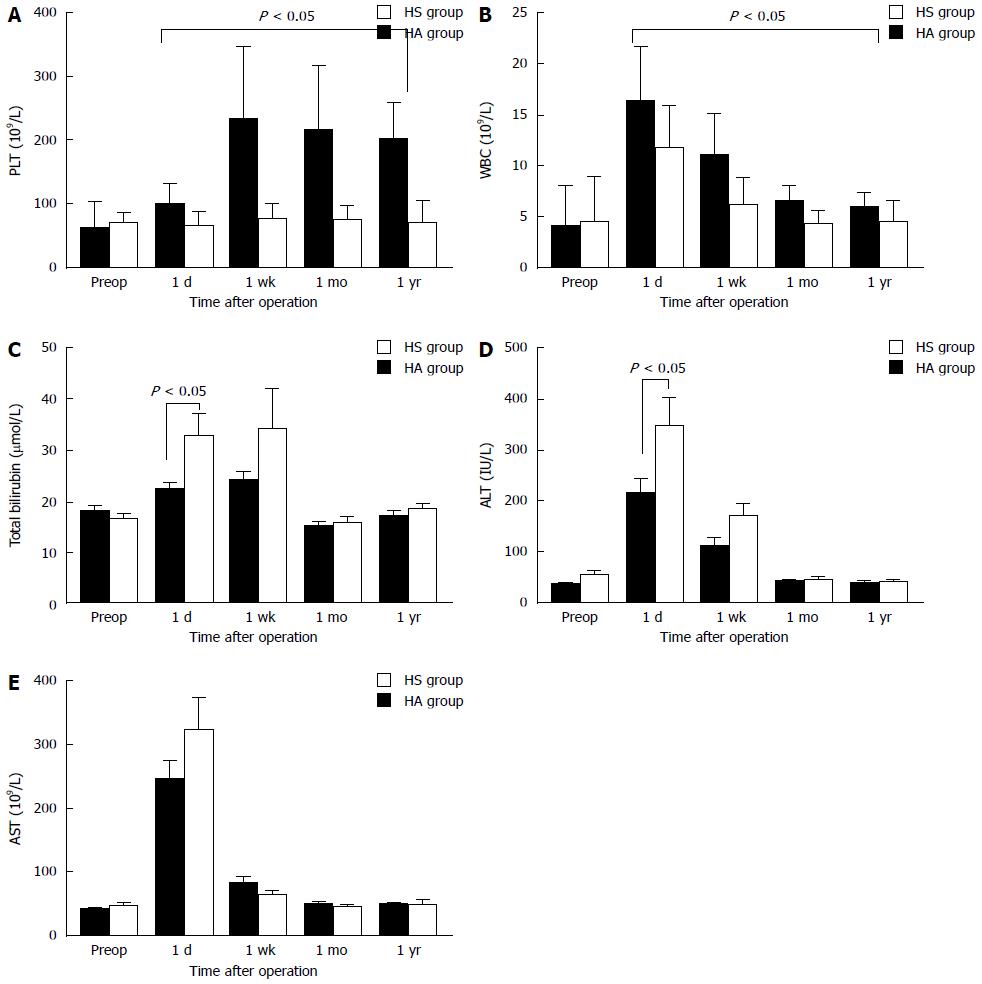
Figure 3 Changes in laboratory test results between the two groups.
The platelet and white blood cell counts in the HS group were significantly increased compared with the HA group one day, one week, one month and one year postoperatively (P < 0.001) (A and B); Total bilirubin and ALT levels were significantly increased in the HA group compared with the HS group on postoperative day one (P < 0.05) and then decreased to levels similar to those observed in the HS group (C and D); E: The AST levels did not differ between the two groups. HS: Hepatectomy and splenectomy; HA: Hepatectomy alone; ALT: Alanine aminotransferase; AST: Aspartate aminotransferase; PLT: Platelet; WBC: White blood cell.
- Citation: Zhang XY, Li C, Wen TF, Yan LN, Li B, Yang JY, Wang WT, Jiang L. Synchronous splenectomy and hepatectomy for patients with hepatocellular carcinoma and hypersplenism: A case-control study. World J Gastroenterol 2015; 21(8): 2358-2366
- URL: https://www.wjgnet.com/1007-9327/full/v21/i8/2358.htm
- DOI: https://dx.doi.org/10.3748/wjg.v21.i8.2358


