Copyright
©The Author(s) 2015.
World J Gastroenterol. Feb 28, 2015; 21(8): 2343-2351
Published online Feb 28, 2015. doi: 10.3748/wjg.v21.i8.2343
Published online Feb 28, 2015. doi: 10.3748/wjg.v21.i8.2343
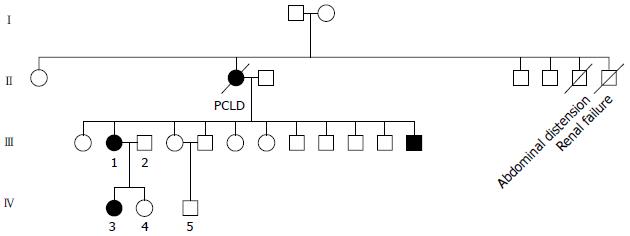
Figure 1 Diagram showing the members of the kindred with polycystic liver disease.
PCLD: Polycystic liver disease.
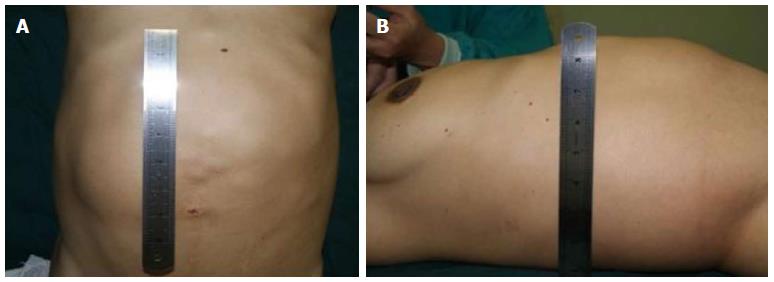
Figure 2 Images showing the proband.
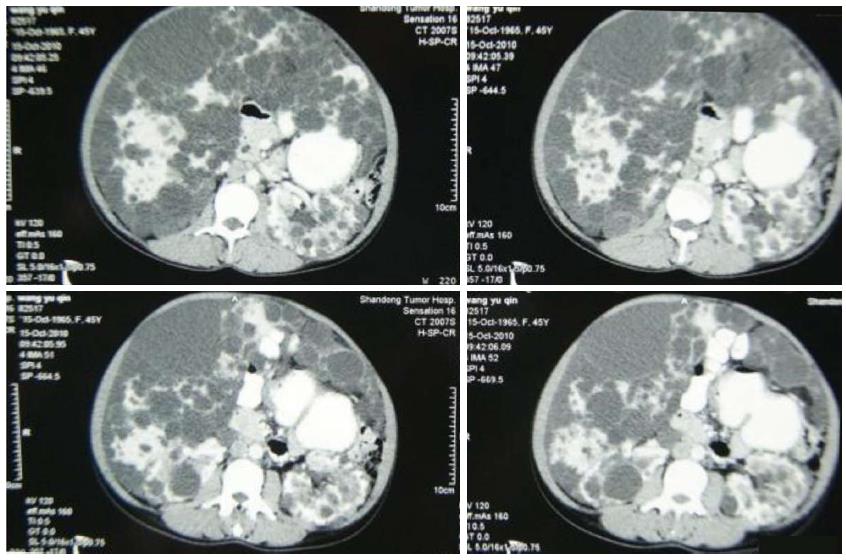
Figure 3 Computed tomography images.
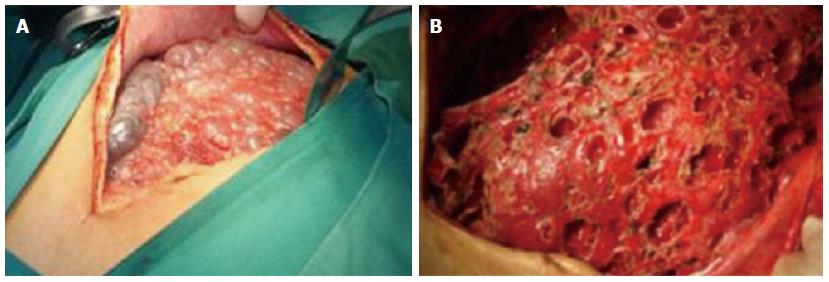
Figure 4 Images showing the findings in the operation.
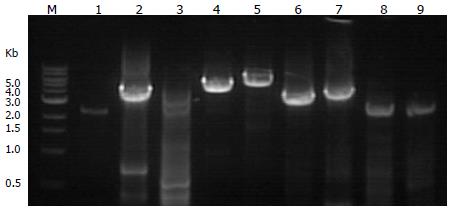
Figure 5 Images showing long-range polymerase chain reaction amplification.
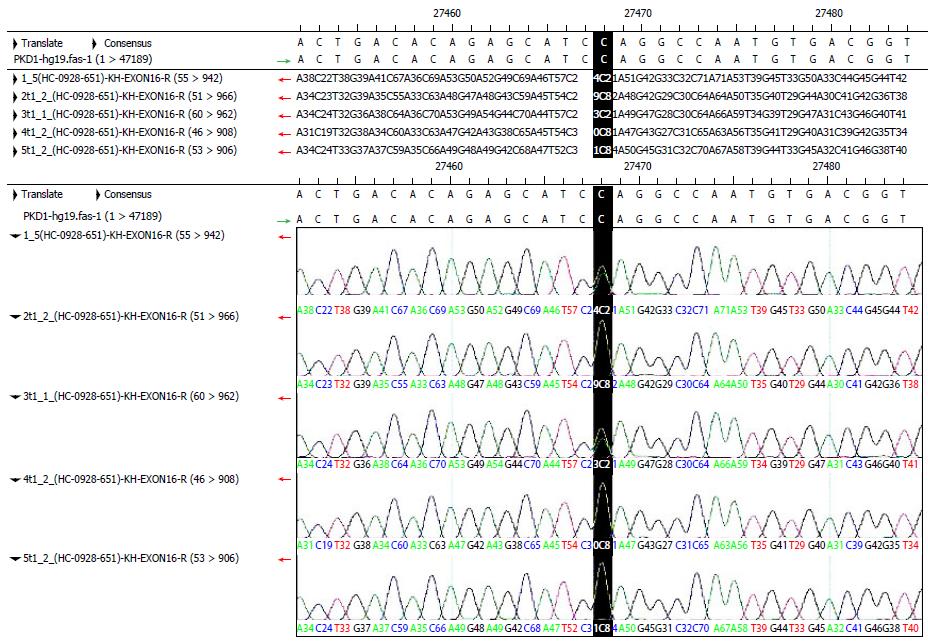
Figure 6 Sequencing peak chart of exon 15 from 5 individuals.
- Citation: Jin S, Cui K, Sun ZQ, Shen YY, Li P, Wang ZD, Li FF, Gong KN, Li S. Screening analysis of candidate gene mutations in a kindred with polycystic liver disease. World J Gastroenterol 2015; 21(8): 2343-2351
- URL: https://www.wjgnet.com/1007-9327/full/v21/i8/2343.htm
- DOI: https://dx.doi.org/10.3748/wjg.v21.i8.2343


