Copyright
©The Author(s) 2015.
World J Gastroenterol. Dec 28, 2015; 21(48): 13480-13489
Published online Dec 28, 2015. doi: 10.3748/wjg.v21.i48.13480
Published online Dec 28, 2015. doi: 10.3748/wjg.v21.i48.13480
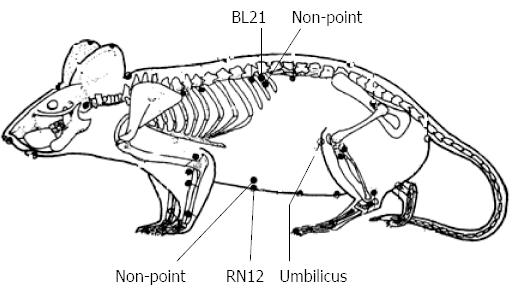
Figure 1 The location of RN12, BL21 and non-points in rat.
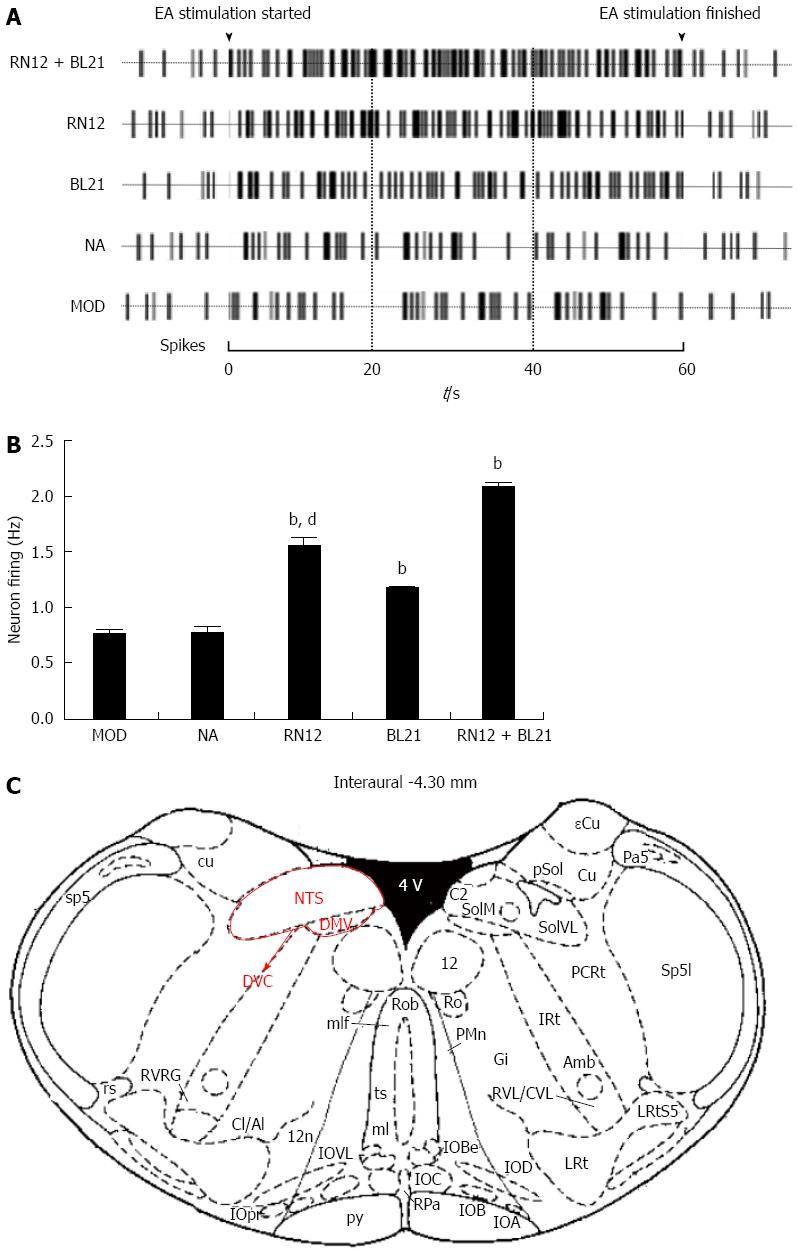
Figure 2 Recording of extracellular neuron firing activity in the dorsal vagal complex.
A: Representative rat neuronal firing pattern in the dorsal vagal complex (DVC) induced by stimulating RN12 and BL21; B: Summarized data for neuronal firing activity by electroacupuncture (EA) stimulation at RN12 and BL21 in DVC (bP < 0.01 vs the MOD group; dP < 0.01 vs the RN12 + BL21 group); C: DVC coordinates: the anatomic location of the DVC and the rat brain in stereotaxic coordinates were adapted from the atlas of Paxinos and Watson.
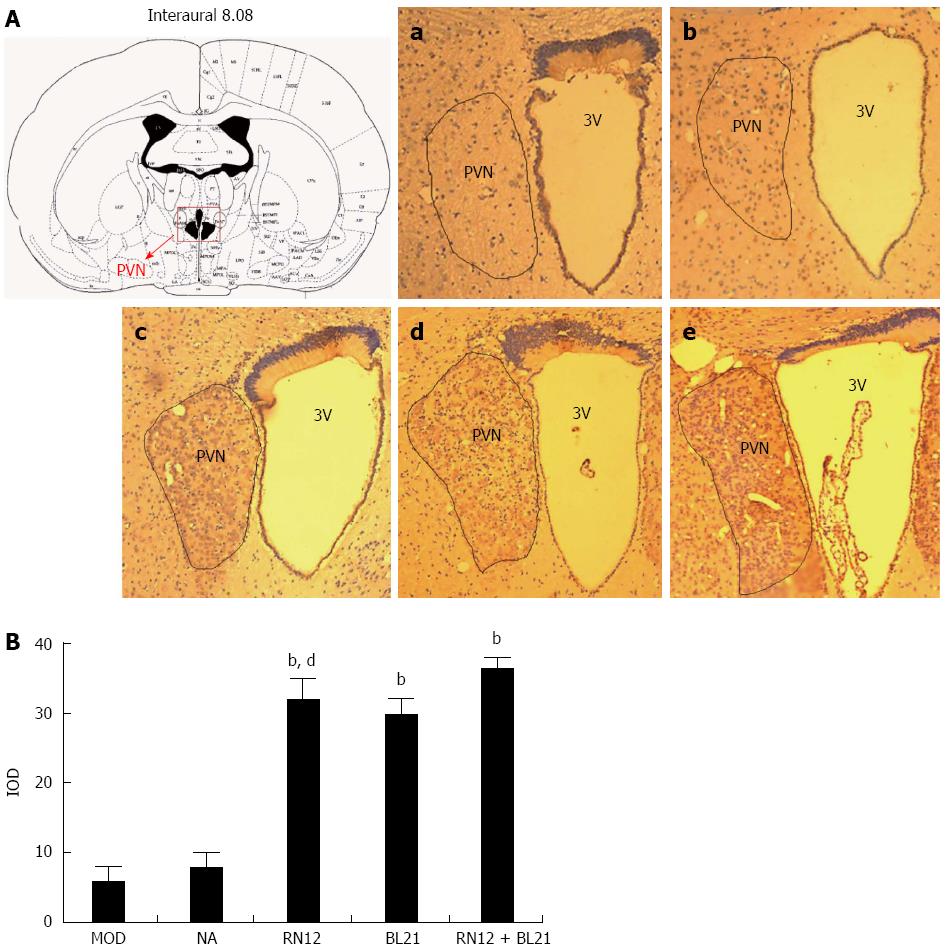
Figure 3 c-fos expression in the paraventricular hypothalamic nucleus.
A: Photomicrographs of the hypothalamus sections showing Fos immunoreactivity in the paraventricular hypothalamic nucleus (PVN). Lane a: Model group; Lane b: Non-acupoint group; Lane c: BL21 group; Lane d: RN12 group; Lane e: RN12 + BL21 group. The anatomic locations of the photomicrographs are indicated at the top, adapted from the atlas of Paxinos and Watson. Fos-positive neurons are presented as dark brown staining in the cell nuclei; B: Integral optical density (IOD) of Fos-positive neurons in the PVN (bP < 0.01 vs the MOD group; dP < 0.01 vs the RN12 + BL21 group). 3 V: Third ventricle.
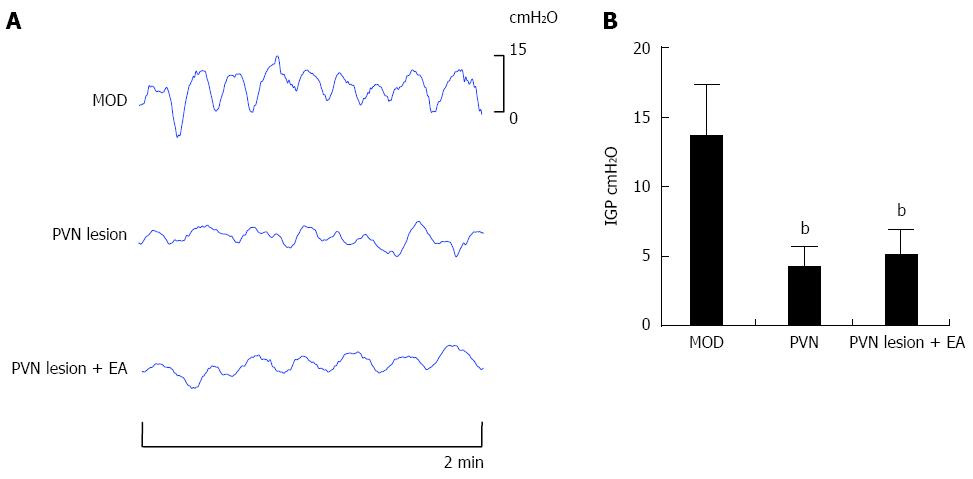
Figure 4 The effects of paraventricular hypothalamic nucleus regulation of intragastric pressure by stimulating RN12 + BL21.
A: Representative waves of intragastric pressure (IGP) in rats induced by damaging the paraventricular hypothalamic nucleus (PVN) with or without stimulating RN12 + BL21; B: Summarized data for the effect of stimulation at RN12 + BL21 with PVN lesion on intragastric pressure (bP < 0.01 vs the MOD group).
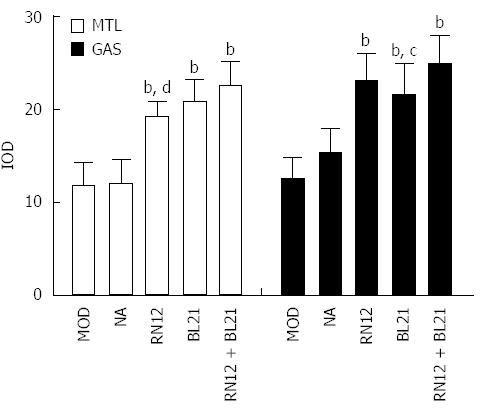
Figure 5 Motilin and gastrin expression in the paraventricular hypothalamic nucleus.
Motilin (MTL) and gastrin (GAS) expression in paraventricular hypothalamic nucleus (PVN) is shown by immunohistochemistry. Summarized data for the expression of MTL and GAS by electroacupuncture (EA) stimulation at RN12 and BL21 in the PVN (bP < 0.01 vs the MOD group; cP < 0.05 or dP < 0.01 vs the RN12 + BL21 group).
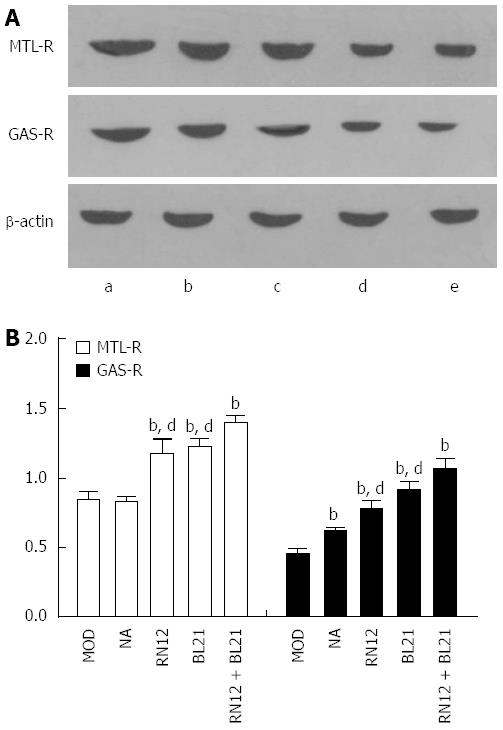
Figure 6 Motilin receptor and gastrin receptor expression in the hypothalamus.
A: Motilin receptor (MTL-R) and gastrin receptor (GAS-R) protein expression in the hypothalamus is shown by western blotting. Lane a: RN12 + BL21 group; Lane b: BL21 group; Lane c: RN12 group; Lane d: Non-acupoint group; Lane e: Model group; B: Summarized data for the expression of MTL-R and GAS-R by electroacupuncture (EA) stimulation at RN12 and BL21 in the hypothalamus (bP < 0.01 vs the MOD group; dP < 0.01 vs the RN12 + BL21 group.
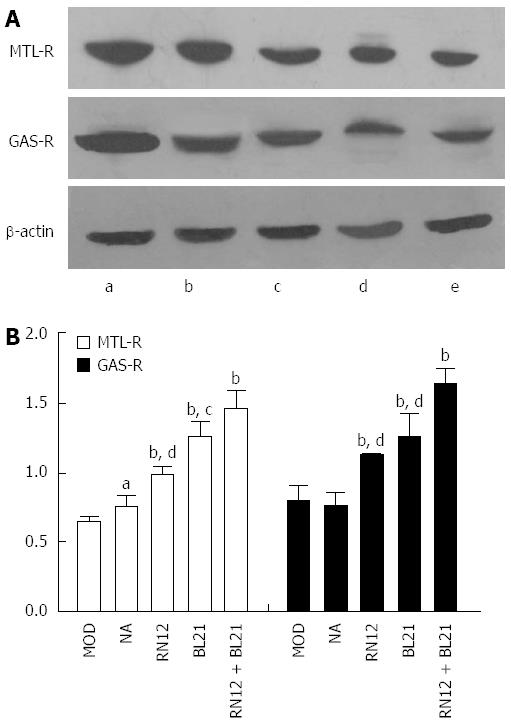
Figure 7 Motilin receptor and gastrin receptor expression in the gastric antrum.
A: Motilin receptor (MTL-R) and gastrin receptor (GAS-R) protein expression in the gastric antrum shown by western blotting. Lane a: RN12 + BL21 group; Lane b: BL21 group; Lane c: RN12 group; Lane d: Non-acupoint group; Lane e: Model group; B: Summarized data for the expression of MTL-R and GAS-R by electroacupuncture (EA) stimulation at RN12 and BL21 in the gastric antrum (aP < 0.05 or bP < 0.01 vs the MOD group; cP < 0.05 or dP < 0.01 vs the RN12 + BL21 group).
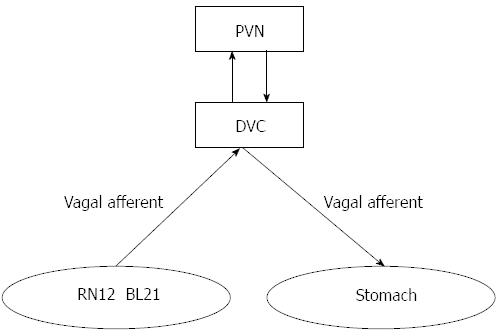
Figure 8 The transmission path of acupuncture signals of the gastric Shu and Mu points.
- Citation: Wang H, Liu WJ, Shen GM, Zhang MT, Huang S, He Y. Neural mechanism of gastric motility regulation by electroacupuncture at RN12 and BL21: A paraventricular hypothalamic nucleus-dorsal vagal complex-vagus nerve-gastric channel pathway. World J Gastroenterol 2015; 21(48): 13480-13489
- URL: https://www.wjgnet.com/1007-9327/full/v21/i48/13480.htm
- DOI: https://dx.doi.org/10.3748/wjg.v21.i48.13480


