Copyright
©2014 Baishideng Publishing Group Inc.
World J Gastroenterol. Jul 7, 2014; 20(25): 8119-8129
Published online Jul 7, 2014. doi: 10.3748/wjg.v20.i25.8119
Published online Jul 7, 2014. doi: 10.3748/wjg.v20.i25.8119
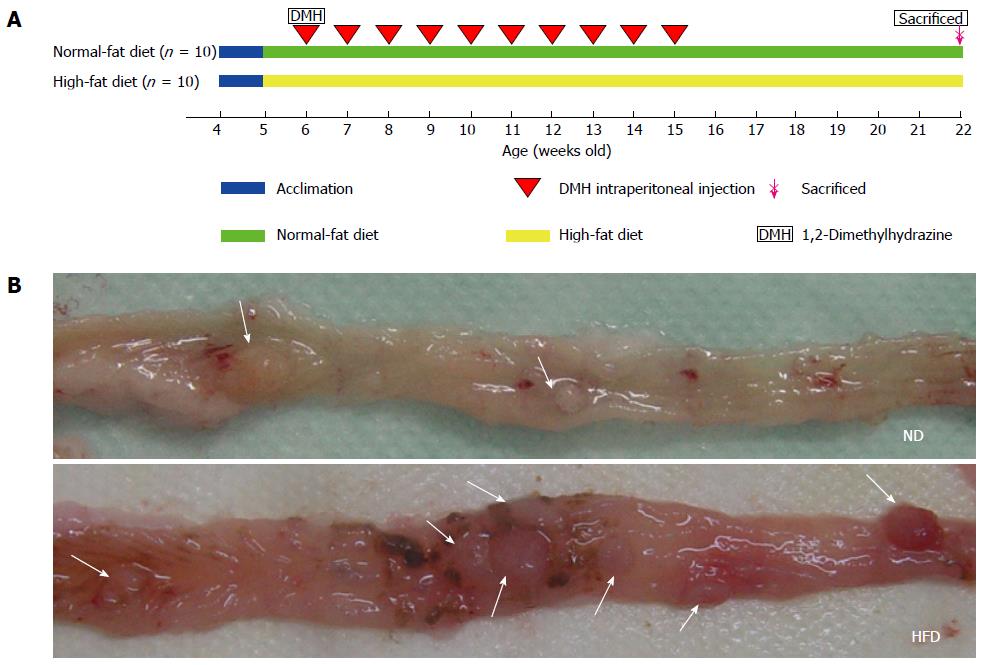
Figure 1 Experiment protocol and representative images of colonic adenomas.
A: Colonic adenoma experiment protocol. Rats (4-wk-old) were divided into a normal-fat diet (ND) group (n = 10) and a high-fat diet (HFD) group (n = 10). Sixteen weeks after the start of 1,2-dimethylhydrazine (DMH) intraperitoneal injection, the rats were euthanized; B: Representative images of adenomas in colon specimens from the ND group (above) and HFD group (below) when the colons were opened longitudinally. The location of the adenomas is indicated by arrows.
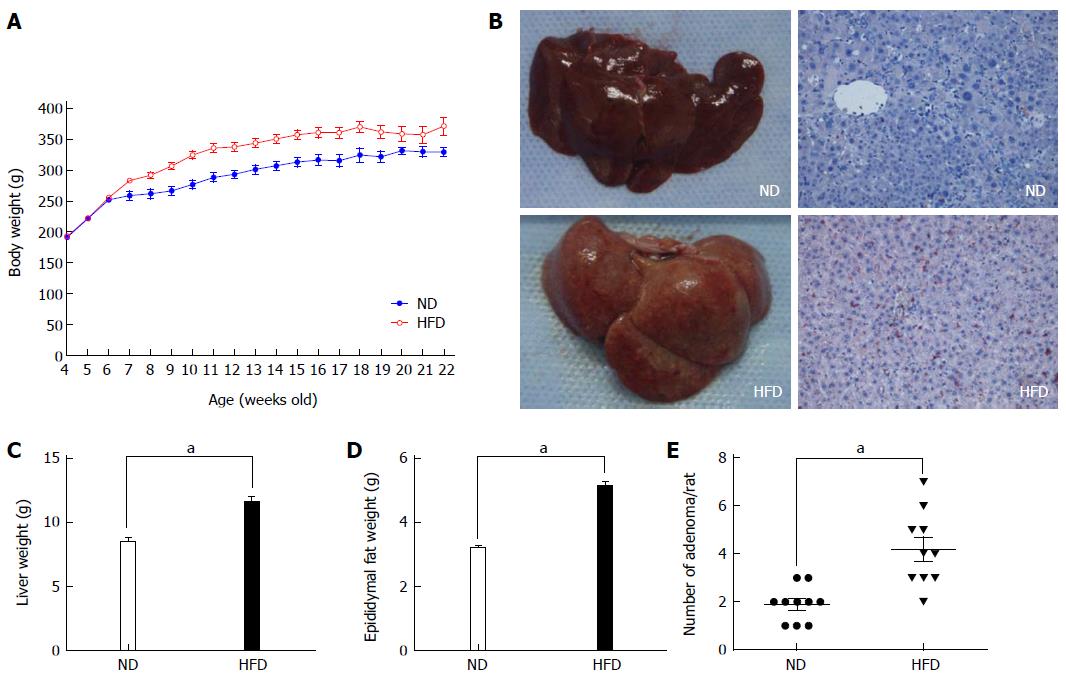
Figure 2 Changes in body weight and representative images of the liver.
A: Changes in body weight of rats fed a normal-fat diet (ND) (blue line, n = 10) and high-fat diet (HFD) (red line, n = 10). Significant differences were observed between the ND and HFD groups at all time points except for the initial 2 wk; B: Representative images of the liver from the ND group (left) and HFD group (right). The liver from the HFD group appeared to have a fatty liver-like appearance, and the Oil Red O staining also present that there are more lipid droplets in the cytoplasm of liver cells. Imaging was documented at × 200 magnification; C: Average weight of the liver from the two groups. Each column represents the mean ± SD of 10 rats/group; D: Average weight of epididymal fat from the two groups. Each column represents the mean ± SD of 10 rats/group. aP < 0.01, ND vs HFD; E: Average number of adenomas for rats fed an ND and HFD.
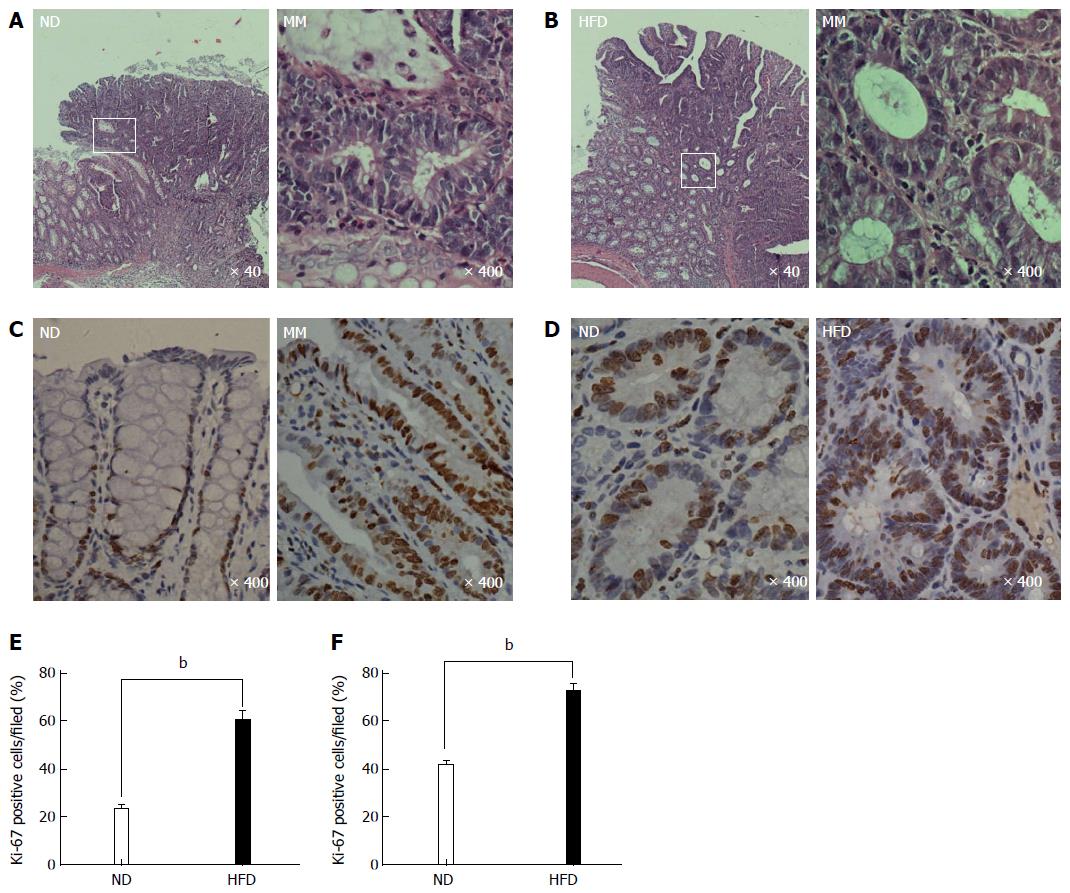
Figure 3 Representative photomicrographs showing the histological characteristics and proliferative state of colonic adenoma.
A and B: Histological characteristics of colonic adenoma in the normal-fat diet/high-fat diet (ND/HFD) groups, and the magnified micrograph (right) highlights the area from the corresponding white rectangle (left); C and D: Representative immunohistochemical staining of proliferative activity (Ki-67, brown) of colonic epithelial cells in the ND/HFD groups; C: Adjacent normal epithelial cells; D; Colonic adenoma tissue; E and F: Ki-67-positive cells were quantified for adjacent normal epithelium (E) and adenoma tissue (F) by counting the positive cells per field (n = 5 per group, bP < 0.01, HFD-fed vs ND-fed). The magnification is marked in the lower right of the pictures, respectively. MM: Magnified micrograph.
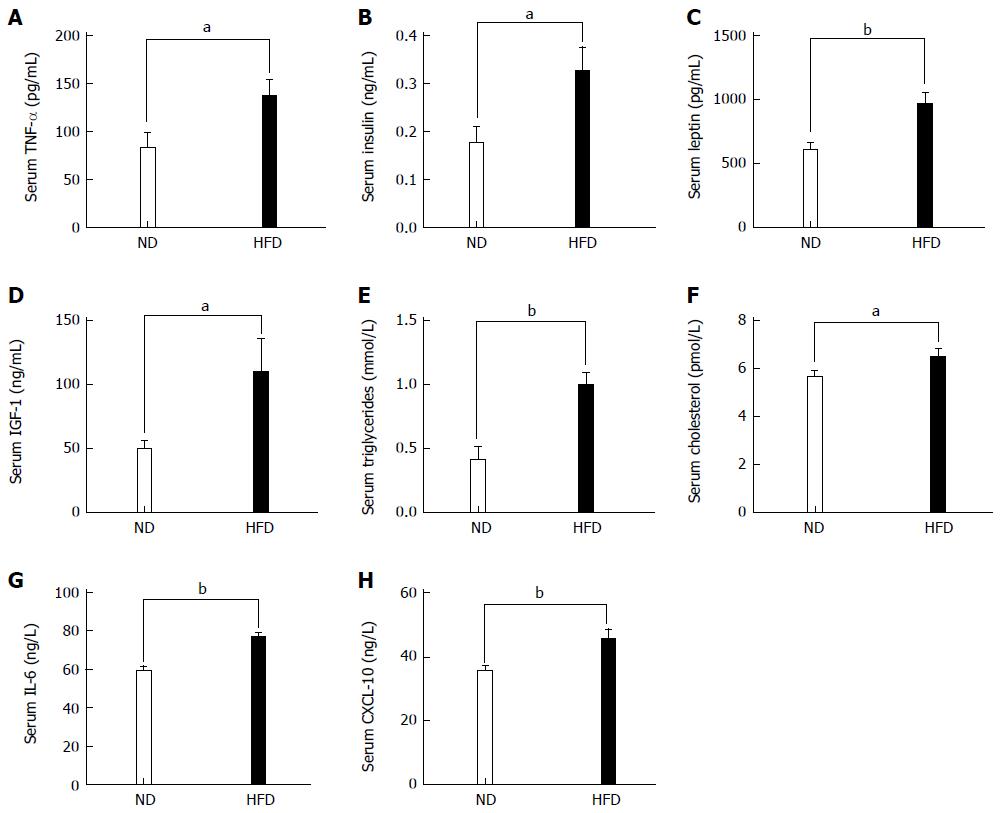
Figure 4 Levels of biochemical indices and inflammatory cytokines in serum between normal-fat diet and high-fat diet groups.
Each column represents the mean ± SD; (n = 10/group). A: Levels of TNF-α (86.62 ± 15.77 vs 136.60 ± 17.60, P = 0.034); B: Levels of insulin (0.176 ± 0.03 vs 0.326 ± 0.05, P = 0.024); C: Levels of leptin (608.70 ± 172.0 vs 966.90 ± 239.0, P = 0.002); D: Levels of IGF-1 (49.46 ± 16.74 vs 110.0 ± 26.29, P = 0.045); E: Levels of triglycerides (0.406 ± 0.108 vs 0.992 ± 0.097, P = 0.002); F: Levels of cholesterol (5.645 ± 0.82 vs 6.486 ± 1.06, P = 0.044); G: Levels of IL-6 (59.08 ± 8.405 vs 76.83 ± 7.310, P = 0.004); H: Levels of CXCL-10 (35.47 ± 5.04 vs 45.57 ± 9.45, P = 0.008). TNF-α: Tumor necrosis factor α; IGF-1: Insulin growth factor 1. IL-6: Interlukin-6; CXCL-10: Chemokine-10. (aP < 0.05, bP < 0.01, ND vs HFD).
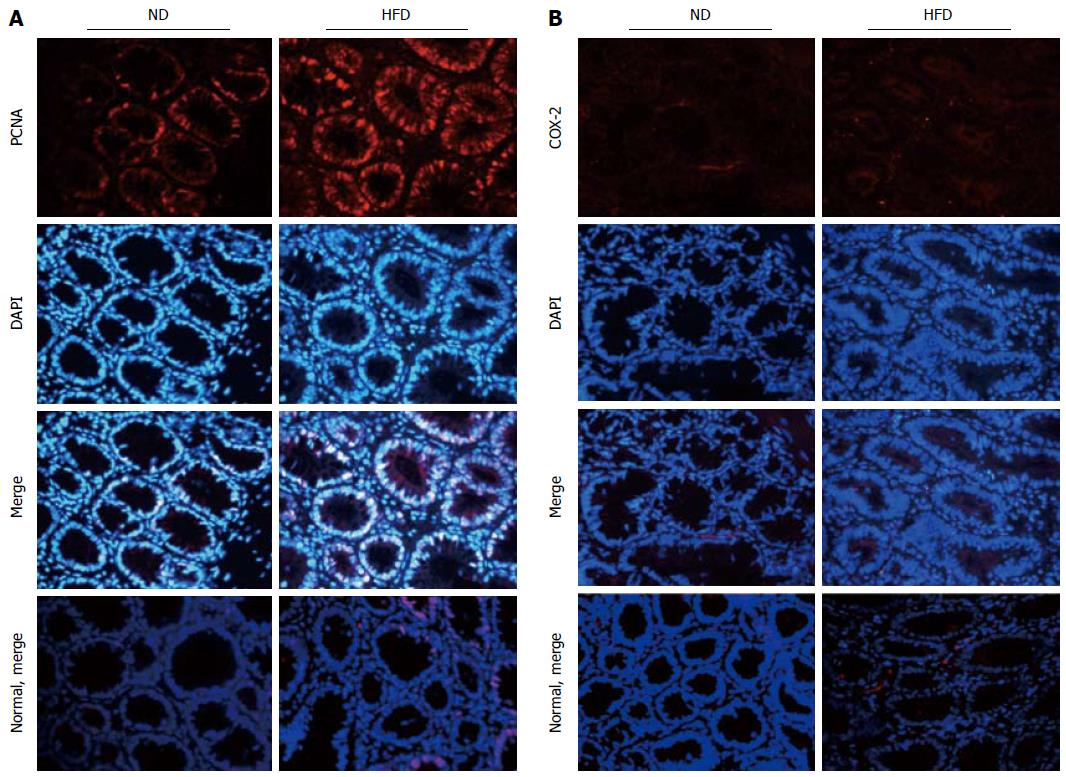
Figure 5 Expression of proliferating cell nuclear antigen and cyclooxygenase -2 in colonic adenoma and normal control tissue for both normal-fat diet and high-fat diet groups by immunofluorescence staining.
A: Representative images of immunofluorescence staining for proliferating cell nuclear antigen (PCNA); B: Representative images of immunofluorescence staining for cyclooxygenase -2 (COX-2). The proteins are stained red with corresponding secondary antibody conjugated with Cy3, and cell nuclei are stained blue with 4,6-diamidino-2-phenylindole (DAPI). Imaging was documented at × 400 magnification. ND: Normal-fat diet; HFD: High-fat diet.
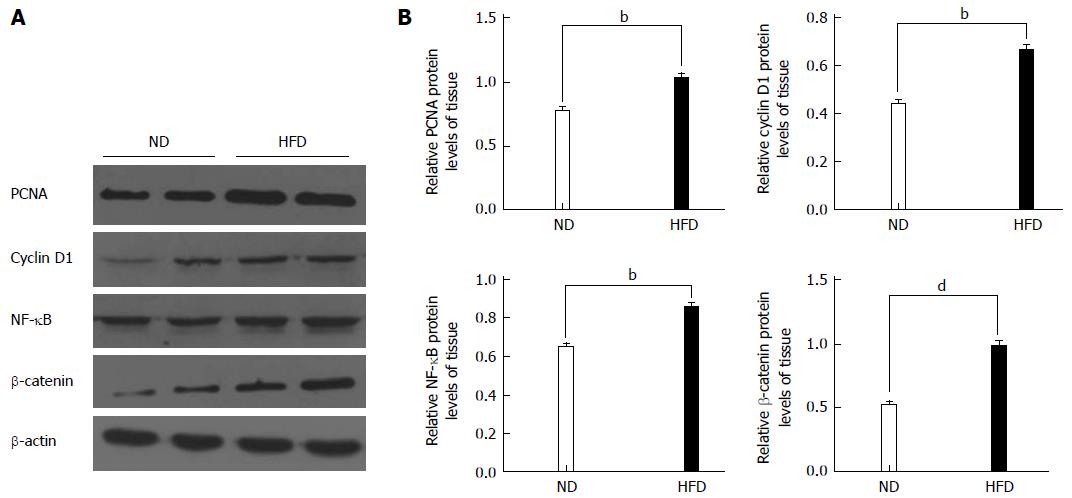
Figure 6 Western blot analyses for proliferating cell nuclear antigen, cyclin D1, nuclear factor-kappa B and β-catenin.
A: Representative Western blotting images are shown in the left panel (n = 8/group); B: Right panel: graphs showing the expression ratio of each protein over β-actin in the high-fat diet (HFD) group compared with the normal-fat diet (ND) group. bP < 0.01, dP < 0.01, HFD group vs ND group. PCNA: Proliferating cell nuclear antigen; NF-κB: Nuclear factor-kappa B.
- Citation: Zhu QC, Gao RY, Wu W, Guo BM, Peng JY, Qin HL. Effect of a high-fat diet in development of colonic adenoma in an animal model. World J Gastroenterol 2014; 20(25): 8119-8129
- URL: https://www.wjgnet.com/1007-9327/full/v20/i25/8119.htm
- DOI: https://dx.doi.org/10.3748/wjg.v20.i25.8119


