Copyright
©2014 Baishideng Publishing Group Co.
World J Gastroenterol. Mar 14, 2014; 20(10): 2653-2663
Published online Mar 14, 2014. doi: 10.3748/wjg.v20.i10.2653
Published online Mar 14, 2014. doi: 10.3748/wjg.v20.i10.2653
Figure 1 Changes in body weight and energy intake.
A: Time-course of body weight. Four-week-old rats were fed a control diet (control group; n = 8) or a high-fat diet (HFD) (n = 16). After 4 wk of feeding, HFD-fed rats were subdivided into two groups (n = 8 per group) and intraperitoneally injected with either 10 μg/kg body weight exenatide [HFD-Ex(+) group] or saline [HFD-Ex(-) group] every day for 12 wk. Rats in the control group were injected with saline. At week 16 of feeding, the body weight was significantly lower in the HFD-Ex(+) group than in the control and HFD-Ex(-) groups. n = 8. aP < 0.05 vs other groups; B: Daily energy intake during the treatment period. Energy intake was lower in the HFD-Ex(+) group than in the control or HFD-Ex(-) group.
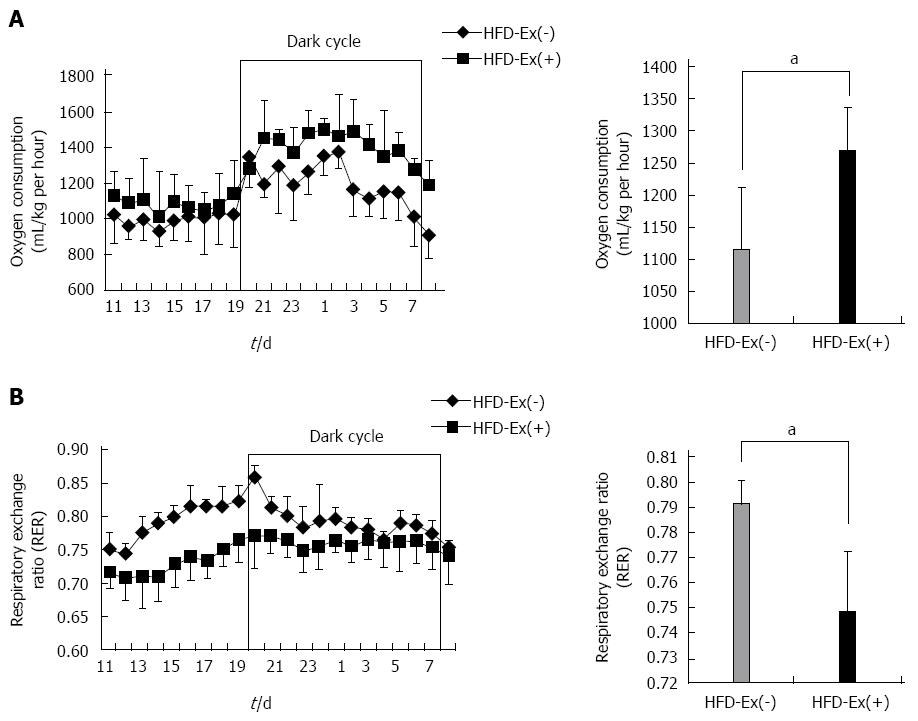
Figure 2 Oxygen consumption and respiratory exchange ratio evaluated by indirect calorimetry in the high-fat diet-Ex(+) and high-fat diet-Ex(-) groups at week 12 of feeding.
A: Oxygen consumption was significantly greater in the high-fat diet (HFD)-Ex(+) group than in the HFD-Ex(-) group, particularly during the dark cycle; B: Respiratory exchange ratio (RER) was significantly lower in the HFD-Ex(+) group than in the HFD-Ex(-) group. n = 4. aP < 0.05 between groups.
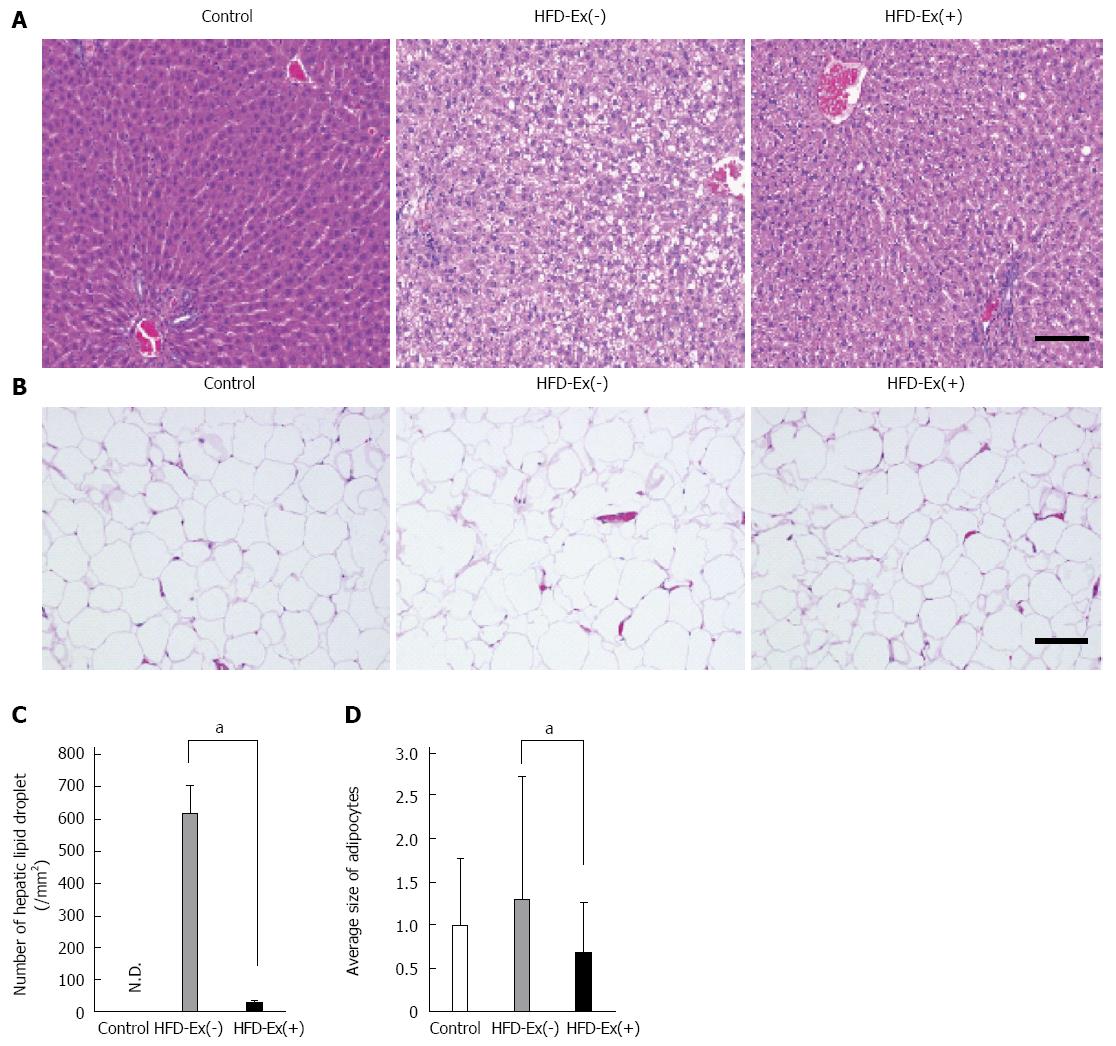
Figure 3 Histological evaluation of lipid accumulation in the liver and adipose tissue.
A: Numerous hepatocytes containing lipid droplets were observed in the high-fat diet (HFD)-Ex(-) group, whereas scant lipid-containing hepatocytes were found in the HFD-Ex(+) group; B: In epididymal white adipose tissue, there were abundant enlarged adipocytes in the HFD-Ex(-) group but not in the HFD-Ex(+) group; C: The number of hepatic lipid droplets was significantly decreased in the HFD-Ex(+) group compared with the HFD-Ex(-) group; D: The mean diameter of adipocytes in the HFD-Ex(+) group was significantly smaller than that in the HFD-Ex(-) group and was similar to that in the control group. The fold changes were calculated as the ratio of the average size of adipocytes in the HFD-Ex(+) or HFD-Ex(-) group to that in the control group. n = 5, aP < 0.05 between groups. Scale bar = 100 μm. ND: Not detected.
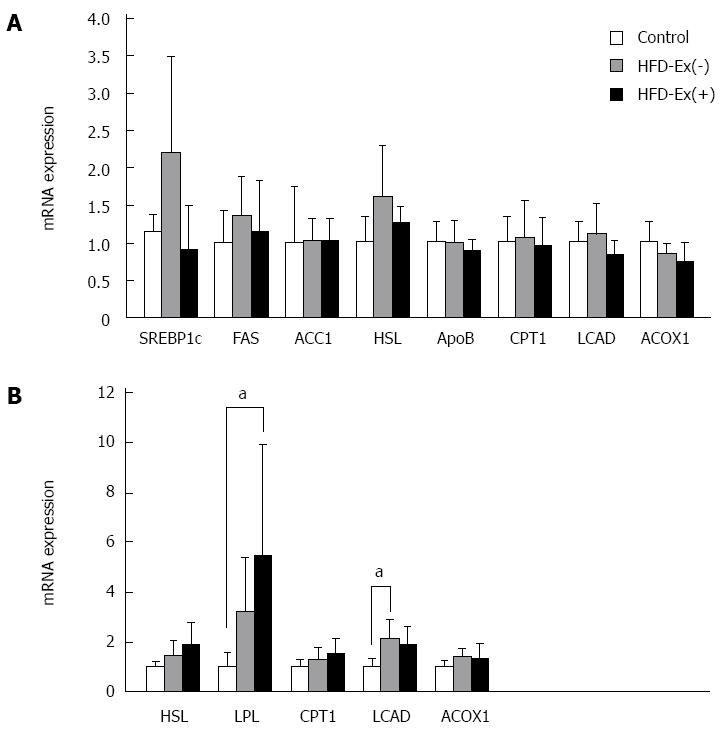
Figure 4 Effects of glucagon-like peptide-1 on the expression levels of genes associated with lipid metabolism in the liver and skeletal muscle.
A: In the liver, there were no significant differences in the expression levels of sterol regulatory element-binding protein-1c (SREBP1c), fatty acid synthase (FAS), acetyl-CoA carboxylase-1 (ACC1), hormone-sensitive lipase (HSL), and apolipoprotein B (ApoB), carnitine palmitoyltransferase-1 (CPT1), long-chain acyl-CoA dehydrogenase (LCAD), or acyl-CoA oxidase 1 (ACOX1) among the three groups; B: In skeletal muscle, the expression of LPL was significantly greater in the high-fat diet (HFD)-Ex(+) group than in the control group. There were no significant differences in the expression levels of HSL, LPL, CPT1, LCAD, or ACOX1 between the HFD-Ex(-) and HFD-Ex(+) group. The fold changes were calculated as the ratio of the expression level in the HFD-Ex(+) or HFD-Ex(-) group to that in the control group. n = 8, aP < 0.05 between groups.
Figure 5 Effects of exenatide on the expression levels of genes associated with lipid metabolism, reactive oxygen species elimination, and macrophage activation in adipose tissue.
A: The expression levels of hormone-sensitive lipase (HSL), carnitine palmitoyltransferase-1 (CPT1), long-chain acyl-CoA dehydrogenase (LCAD), and acyl-CoA oxidase 1 (ACOX1) were significantly greater in the high-fat diet (HFD)-Ex(+) group than in the control and HFD-Ex(-) groups; B: The expression levels of catalase and superoxide dismutase (SOD)2 were significantly greater in the HFD-Ex(+) group than in the control and HFD-Ex(-) groups. There were no significant differences in tumor necrosis factor (TNF) or monocyte chemotactic protein 1 (MCP1) expression levels among the three groups. The fold changes were calculated as the ratio of the expression level in the HFD-Ex(+) or HFD-Ex(-) group to that in the control group. n = 8, aP < 0.05 between groups.
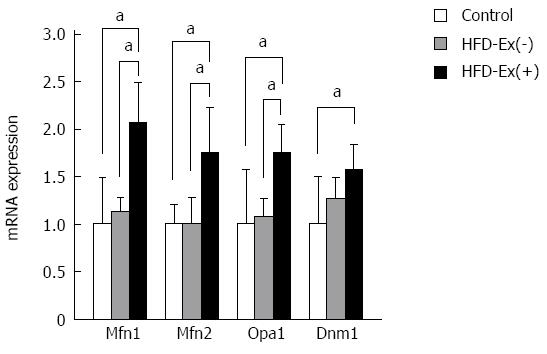
Figure 6 Effects of exenatide on the expression levels of mitochondrial morphologic regulators in adipose tissue.
Genes involved in mitochondrial fusion [mitofusin-1 (Mfn1) and mitofusin-2 (Mfn2) and optic atrophy-1 (Opa1)] were significantly greater in the high-fat diet (HFD)-Ex(+) group than in the control and HFD-Ex(-) groups. The expression of dynamin-1 (Dnm1), which is involved in mitochondrial fission, was not significantly different between the HFD-Ex(+) and HFD-Ex(-) groups. The fold changes were calculated as the ratio of the expression level in the HFD-Ex(+) or HFD-Ex(-) group to that in the control group. n = 8, aP < 0.05 between groups.
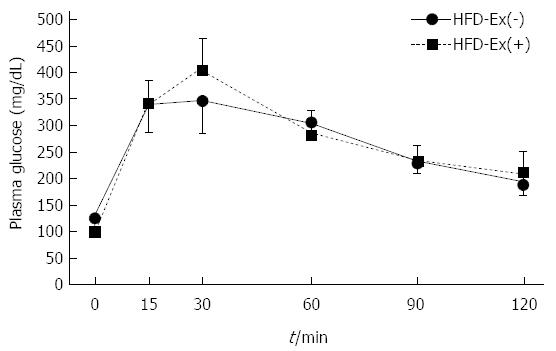
Figure 7 Effect of exenatide on glucose tolerance.
Intraperitoneal glucose tolerance tests (IPGTTs) were performed in the high-fat diet (HFD)-Ex(+) and HFD-Ex(-) groups at week 12 of feeding. Fasting plasma glucose levels were slightly lower in the HFD-Ex(+) group than in the HFD-Ex(-) group, but no significant differences were observed at the other times during the IPGTTs.
Figure 8 Effects of exenatide on AMP-activated protein kinase activation in adipose tissue.
Immunoblotting for total AMP-activated protein kinase (AMPK), phosphorylated AMPK (P-AMPK), and β-actin were performed. The protein levels of total AMPK and P-AMPK were not significantly different among the three groups. HFD: High-fat diet.
- Citation: Tanaka K, Masaki Y, Tanaka M, Miyazaki M, Enjoji M, Nakamuta M, Kato M, Nomura M, Inoguchi T, Kotoh K, Takayanagi R. Exenatide improves hepatic steatosis by enhancing lipid use in adipose tissue in nondiabetic rats. World J Gastroenterol 2014; 20(10): 2653-2663
- URL: https://www.wjgnet.com/1007-9327/full/v20/i10/2653.htm
- DOI: https://dx.doi.org/10.3748/wjg.v20.i10.2653


