Copyright
©2014 Baishideng Publishing Group Co.
World J Gastroenterol. Mar 14, 2014; 20(10): 2482-2491
Published online Mar 14, 2014. doi: 10.3748/wjg.v20.i10.2482
Published online Mar 14, 2014. doi: 10.3748/wjg.v20.i10.2482
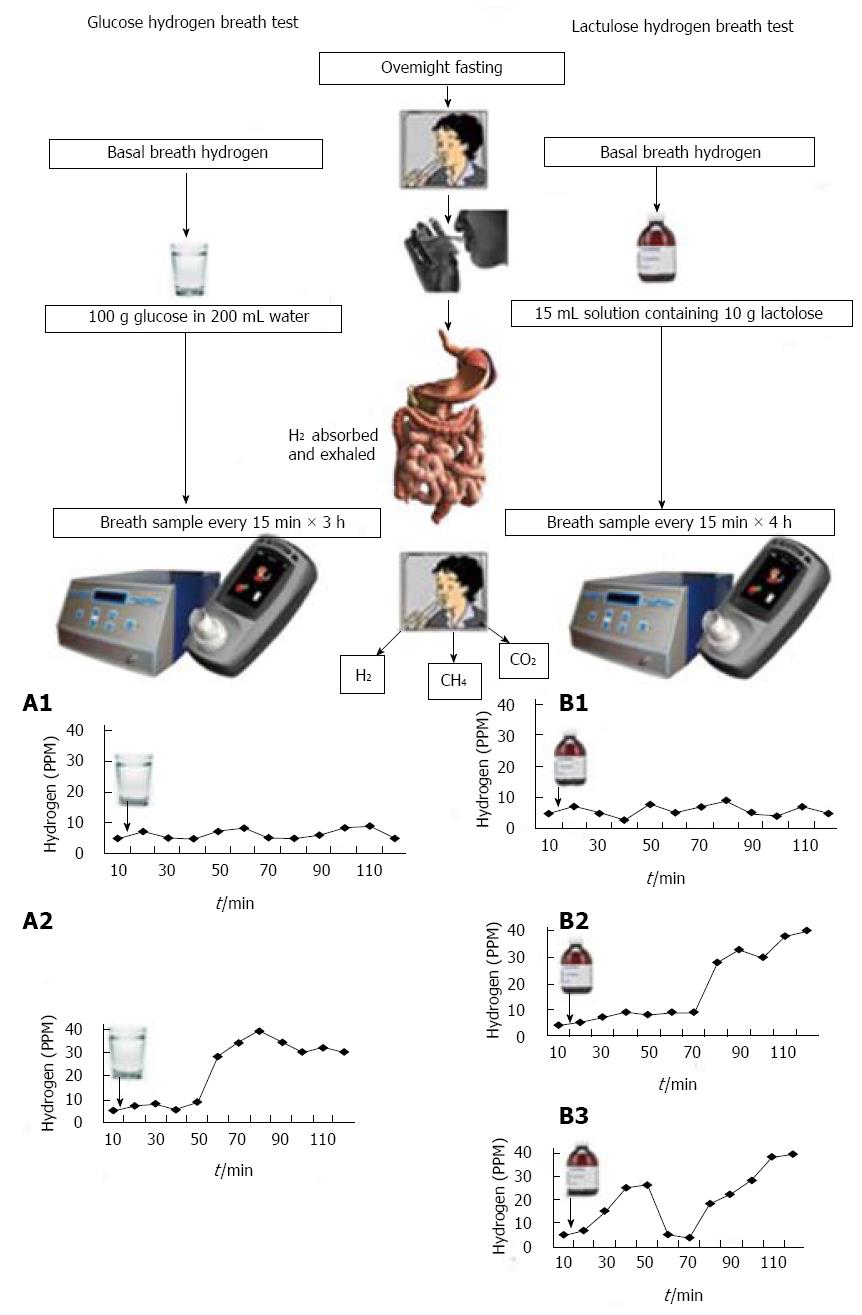
Figure 1 Outline of principle of method and interpretation of glucose and lactulose hydrogen breath tests.
On the left panel, method and result of glucose hydrogen breath test (GHBT) is shown. A1: GHBT is negative for SIBO as there is no peak in hydrogen production; A2: GHBT shows presence of SIBO. On the right panel, method and result of lactulose hydrogen breath test (LHBT) is shown. B1: LHBT is negative for SIBO as there is no peak in hydrogen production; B2: LHBT shows an early peak (within 90 min of lactulose ingestion); B3: LHBT shows double peaks in hydrogen, the earlier one from small bowel due to SIBO and the later one from the colon. Please note that Quintron machine of the left gives values of hydrogen, methane and CO2 (for correction) and the Bedfont machine of right side estimates hydrogen only. It is also important to note that in the graphs hydrogen breath test do not show methane levels. SIBO: Small intestinal bacterial overgrowth; GHBT: Glucose hydrogen breath test; LHBT: Lactulose hydrogen breath Test; PPM: Parts per million.
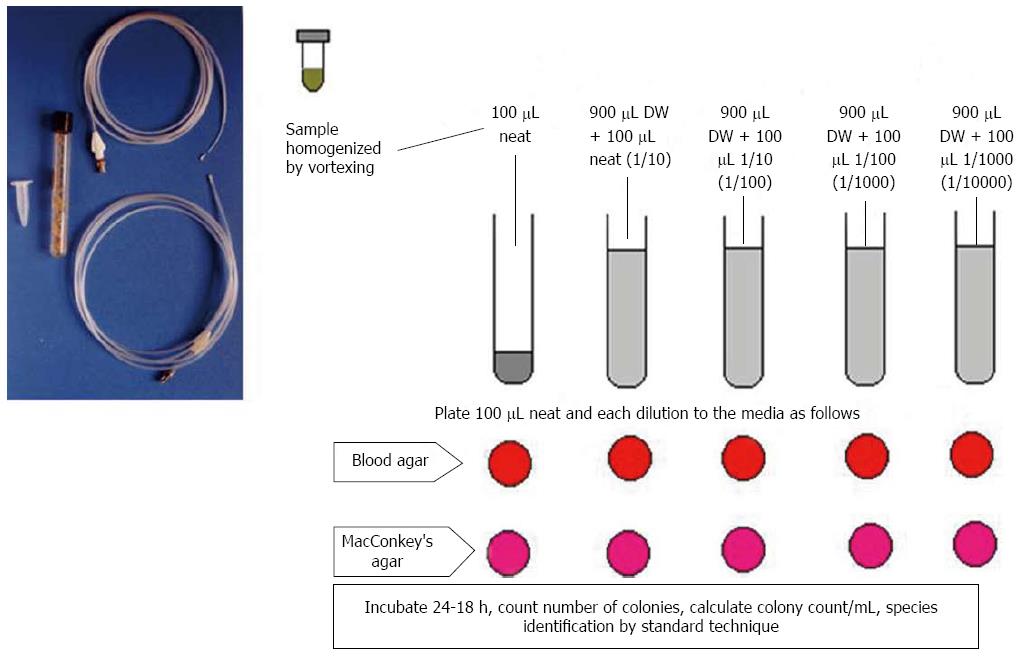
Figure 2 Outline of method of culturing bacteria from the upper gut aspirate and counting the colonies by serial dilution technique.
DW: Distilled water.
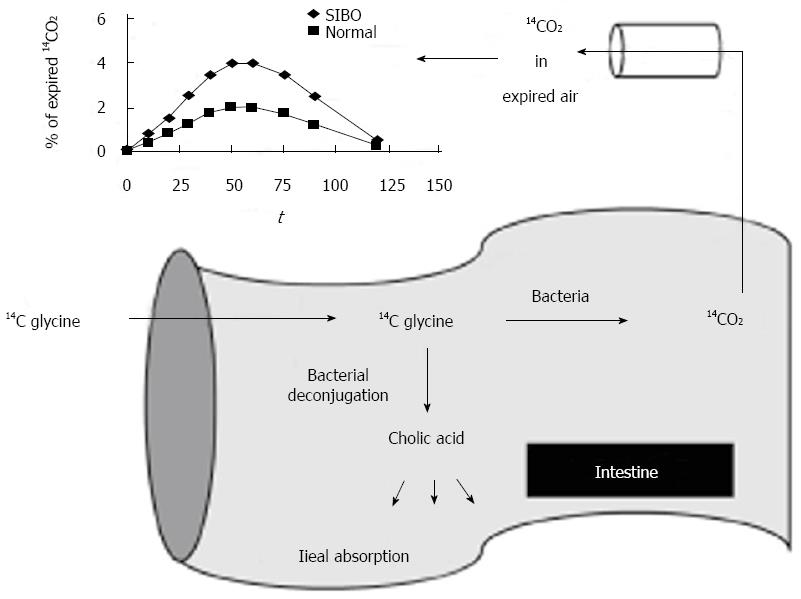
Figure 3 Bile acid breath test involves the administration of the bile acid 14C glycocholic acid, and the detection of 14CO2, which would be elevated in small intestinal bacterial overgrowth.
- Citation: Ghoshal UC, Srivastava D. Irritable bowel syndrome and small intestinal bacterial overgrowth: Meaningful association or unnecessary hype. World J Gastroenterol 2014; 20(10): 2482-2491
- URL: https://www.wjgnet.com/1007-9327/full/v20/i10/2482.htm
- DOI: https://dx.doi.org/10.3748/wjg.v20.i10.2482


