Copyright
©2014 Baishideng Publishing Group Co.
World J Gastroenterol. Jan 7, 2014; 20(1): 193-203
Published online Jan 7, 2014. doi: 10.3748/wjg.v20.i1.193
Published online Jan 7, 2014. doi: 10.3748/wjg.v20.i1.193
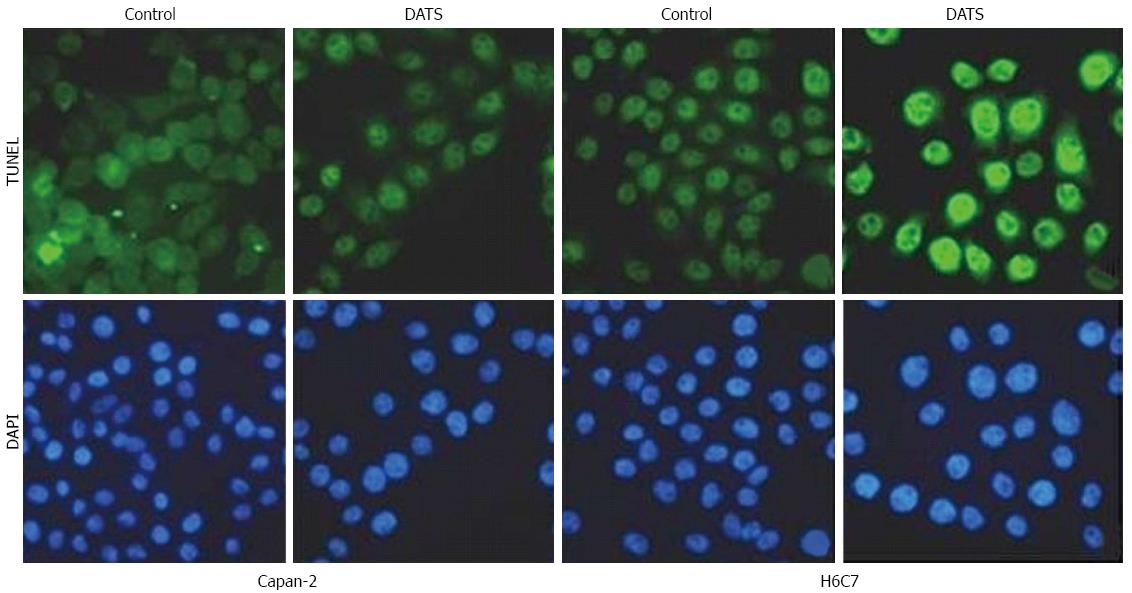
Figure 1 TUNEL assay to determine diallyl trisulfide-induced apoptosis of Capan-2 and H6C7 cells.
TUNEL assay was used to confirm induction of apoptosis in treated and untreated cells. Both Capan-2 and H6C7 cells were treated with 100 μmol/L diallyl trisulfide for 24 h and induction of apoptosis was confirmed by the appearance of TUNEL-positive cells; DATS: Diallyl trisulfide; DAPI: 4',6-diamidino-2-phenylindole.
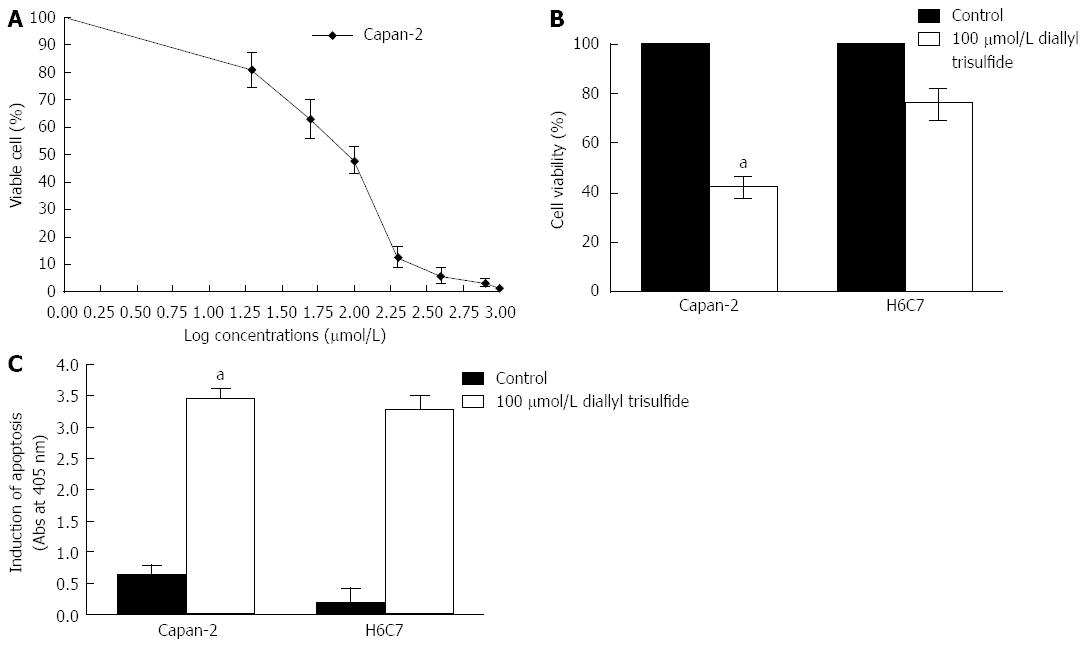
Figure 2 Diallyl trisulfide induces apoptosis of Capan-2 cells and H6C7 cells.
A: Capan-2 cells were exposed to different concentrations of diallyl trisulfide (DATS) and the percentage of viable cells was determined by methyl thiazolyl tetrazolium (MTT) assay. Capan-2 and H6C7 cells were exposed to 100 μmol/L DATS for 24 h. Cells without DATS treatment were used as controls. Living cells was detected by MTT assay. Data points = mean ± SD of quadruplicate values for each independent experiment; B: The percentage survival of Capan-2 and H6C7 cells was significantly different (aP < 0.05); C: ELISA was used to determine apoptotic cells. Each condition was performed in quadruplicate. Data are presented as mean ± SD.
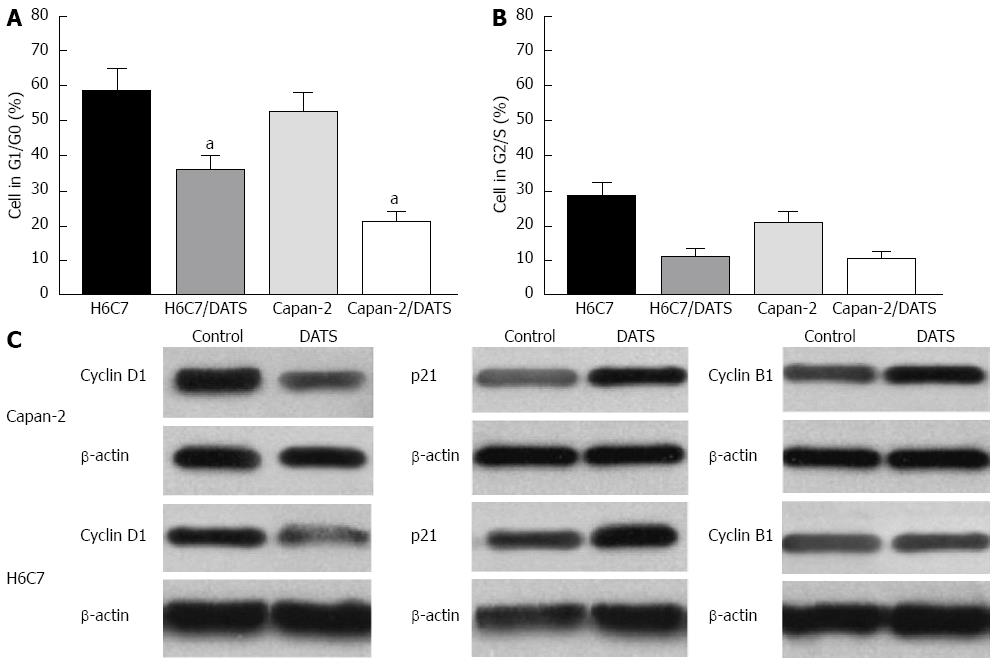
Figure 3 Diallyl trisulfide modulates cell cycle progression in Capan-2 and H6C7 cells.
Diallyl trisulfide (DATS) (100 μmol/L) arrested Capan-2 and H6C7 cells in G1/G0 phase and G2/S phase. The percentage of cells in different phases was determined in Capan-2 and H6C7 cells after treatment with 100 μmol/L DATS for 24 h. A: DATS (100 μmol/L) arrested more Capan-2 cells in G1/G0 phase (aP < 0.05 vs H6C7 cells); B: No significant difference was found in the percentage of cells in the G2/S phase in both Capan-2 and H6C7 cells compared with control cells; C: DATS upregulated p21 and cyclin B1 expression and downregulated cyclin D1 expression in Capan-2 and H6C7 cells. Each data point is the mean of three independent experiments and expressed as mean ± SD.
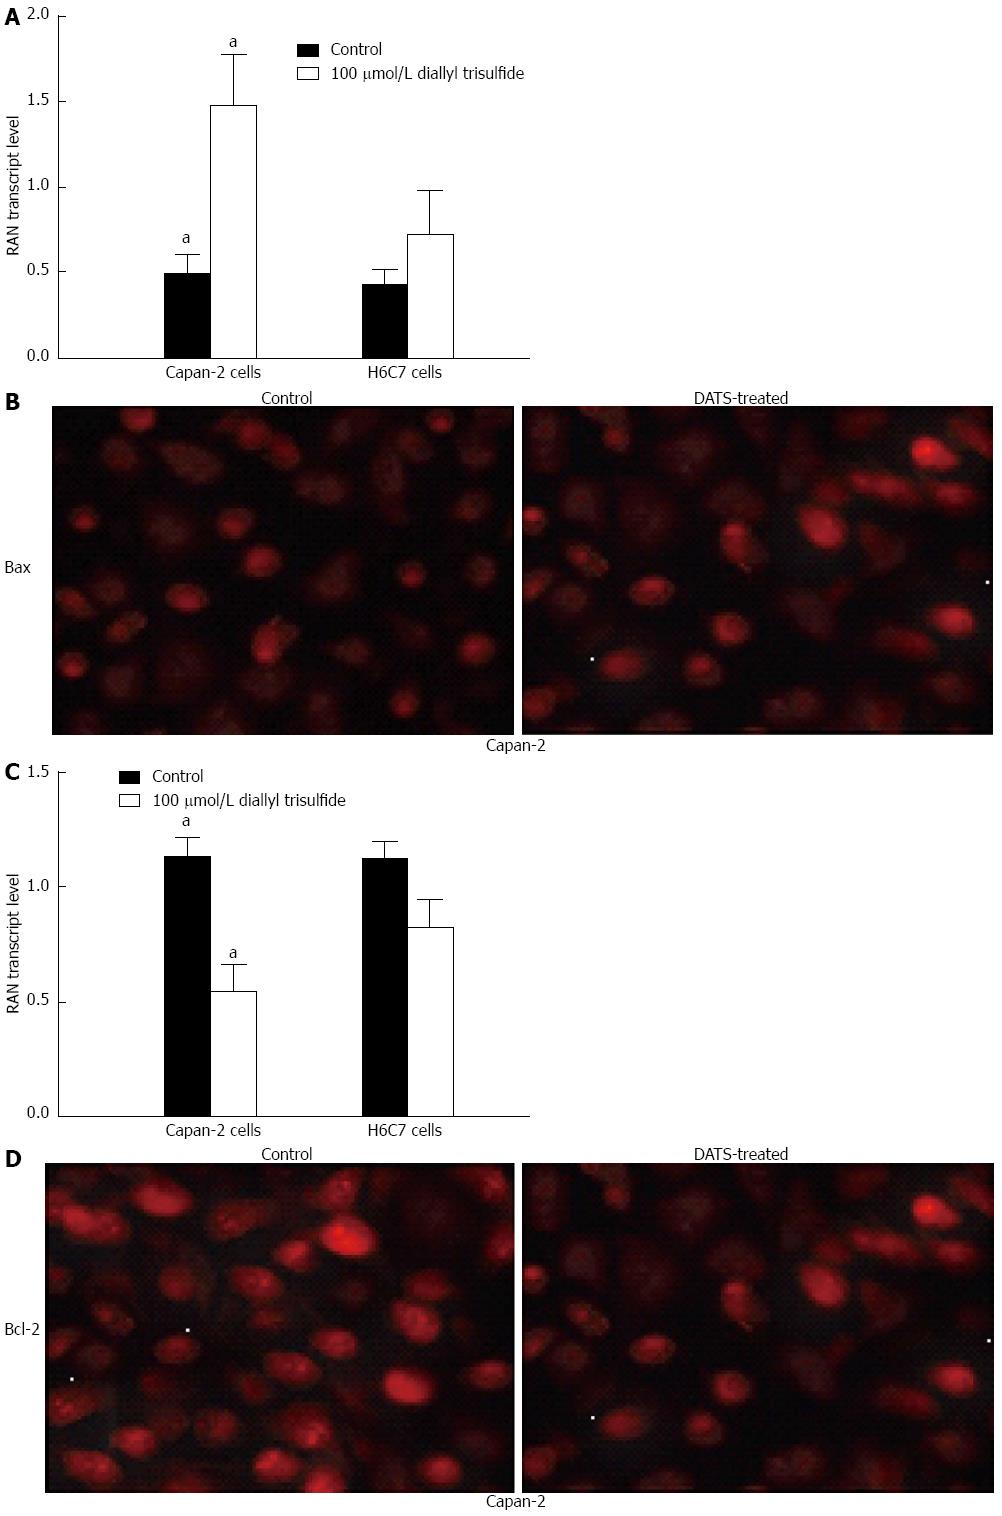
Figure 4 Diallyl trisulfide treatment induces Bax and bcl-2 expression in Capan-2 cells.
Capan-2 cells were treated with 100 μmol/L diallyl trisulfide (DATS) for 24 h. Untreated cells were used as controls. A, C: Total RNA was extracted and reversely transcribed to cDNA for RT-PCR analysis of Bax and Bcl-2 mRNA levels (aP < 0.05 vs H6C7 cells); B, D: Bax and Bcl-2 in Capan-2 cells were immunostained using anti-Bax and anti-Bcl-2 antibodies as the primary antibody and Texas Red-conjugated IgG as the secondary antibody. The individual images for Bax and Bcl-2 were taken at a magnification of × 200, under an immunofluorescence microscope. Representative data from three independent experiments are shown.
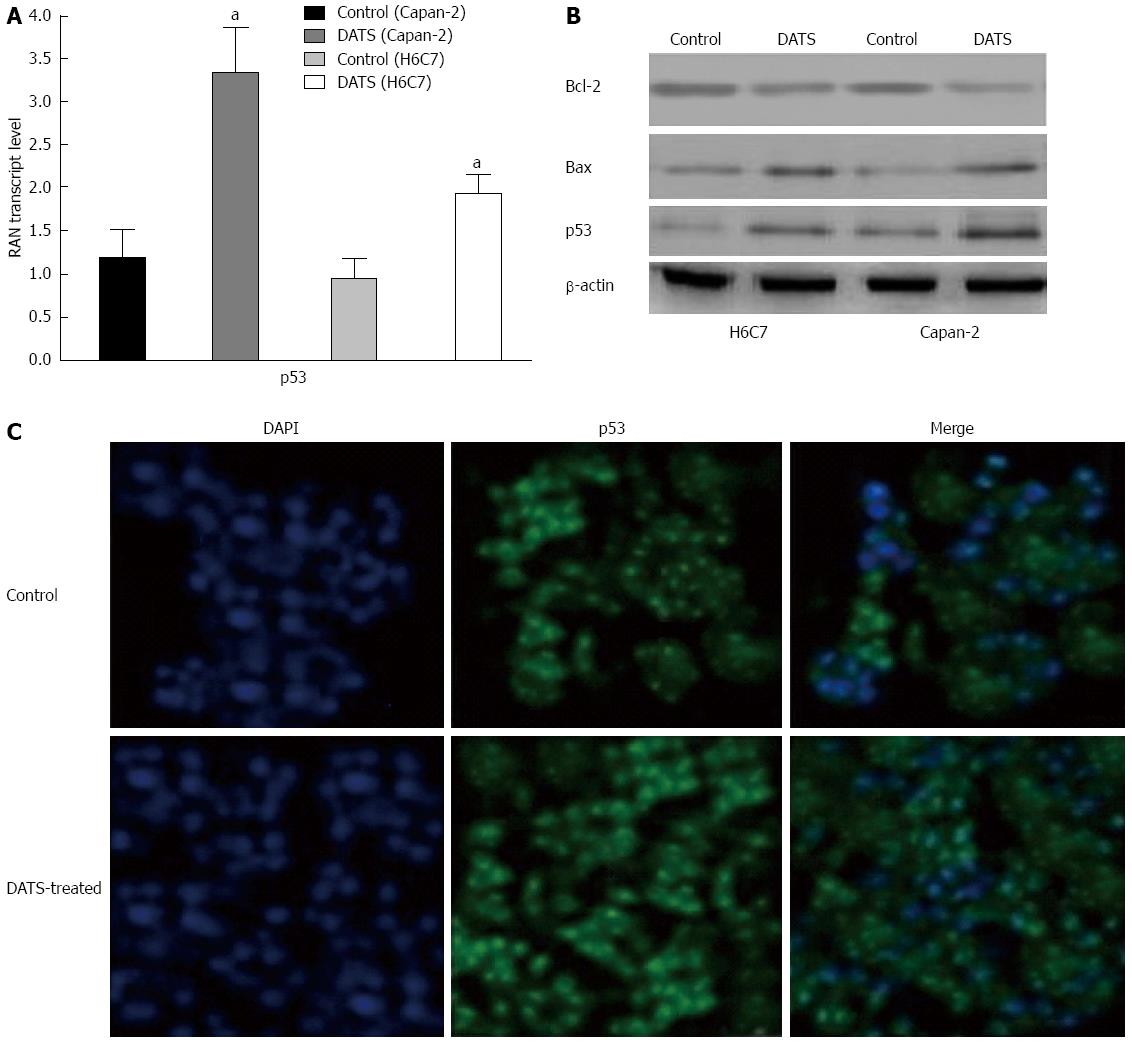
Figure 5 Diallyl trisulfide upregulates Bax expression and deregulates Bcl-2 expression and p53 translocation to the nucleus in Capan-2 cells.
A and B: Cells were treated with 100 μmol/L of diallyl trisulfide (DATS) for 24 h (aP < 0.05 vs control). Cells were lysed and total protein was collected and subjected to Western blot analysis to determine p53, Bax and Bcl-2 protein expression levels in treated and untreated control cells. β-actin was used as a loading control; C: The subcellular localization of p53 was indicated by the green FITC, while the position of the nucleus was shown by the blue DAPI staining. Individual images for p53 localization in the nucleus were taken at a magnification of × 400. Images were merged to display the subcellular localization of p53, using ECLIPSE. Representative data from three independent experiments are shown. DAPI: 4',6-diamidino-2-phenylindole.
Figure 6 Diallyl trisulfide modulates survival and apoptotic signals in Capan-2 cells.
Capan-2 cells were treated with 100 μmol/L of diallyl trisulfide (DATS) for 24 h. A: Western blot was performed to determine the protein expression level of p53, Bcl-2, Fas, Akt, cyclin D1 and MDM2 in Capan-2 cells. Untreated cells were used as controls; B: mRNA was extracted and reversed transcribed to cDNA for real-time polymerase chain reaction analysis of mRNA levels. Each data point is an average of three independent experiments and expressed as mean ± SD (aP < 0.05 vs control).
- Citation: Ma HB, Huang S, Yin XR, Zhang Y, Di ZL. Apoptotic pathway induced by diallyl trisulfide in pancreatic cancer cells. World J Gastroenterol 2014; 20(1): 193-203
- URL: https://www.wjgnet.com/1007-9327/full/v20/i1/193.htm
- DOI: https://dx.doi.org/10.3748/wjg.v20.i1.193


