Copyright
©2013 Baishideng Publishing Group Co.
World J Gastroenterol. Aug 21, 2013; 19(31): 5199-5203
Published online Aug 21, 2013. doi: 10.3748/wjg.v19.i31.5199
Published online Aug 21, 2013. doi: 10.3748/wjg.v19.i31.5199
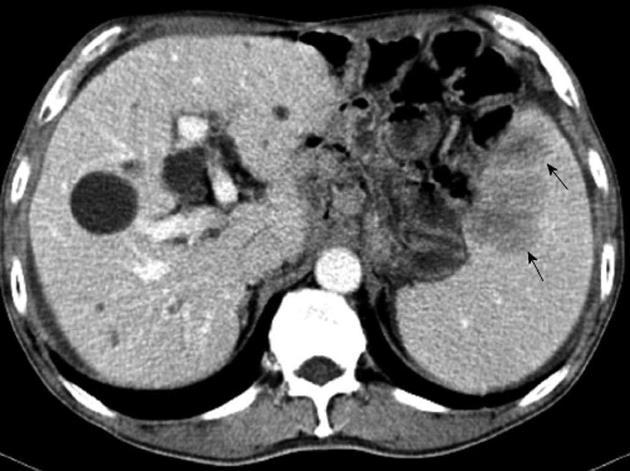
Figure 1 Computed tomography showed two low-density lesions (arrows), 4.
5 cm × 3.5 cm and 2.5 cm × 2.0 cm in size respectively, at the upper pole of the spleen.
Figure 2 Cross section of the spleen showing two yellowish-white lesions at the upper pole.
Figure 3 Histological findings of the primary gastric carcinoma (A) and the splenic metastatic tumor (B) (hematoxylin-eosin stain, × 40).
- Citation: Zhu YP, Mou YP, Ni JJ, Zhou YC, Jiang JW, Jiang ZN, Wang GY. Isolated splenic metastases from gastric carcinoma: A case report and literature review. World J Gastroenterol 2013; 19(31): 5199-5203
- URL: https://www.wjgnet.com/1007-9327/full/v19/i31/5199.htm
- DOI: https://dx.doi.org/10.3748/wjg.v19.i31.5199


