Copyright
©2013 Baishideng Publishing Group Co.
World J Gastroenterol. Aug 21, 2013; 19(31): 5150-5158
Published online Aug 21, 2013. doi: 10.3748/wjg.v19.i31.5150
Published online Aug 21, 2013. doi: 10.3748/wjg.v19.i31.5150
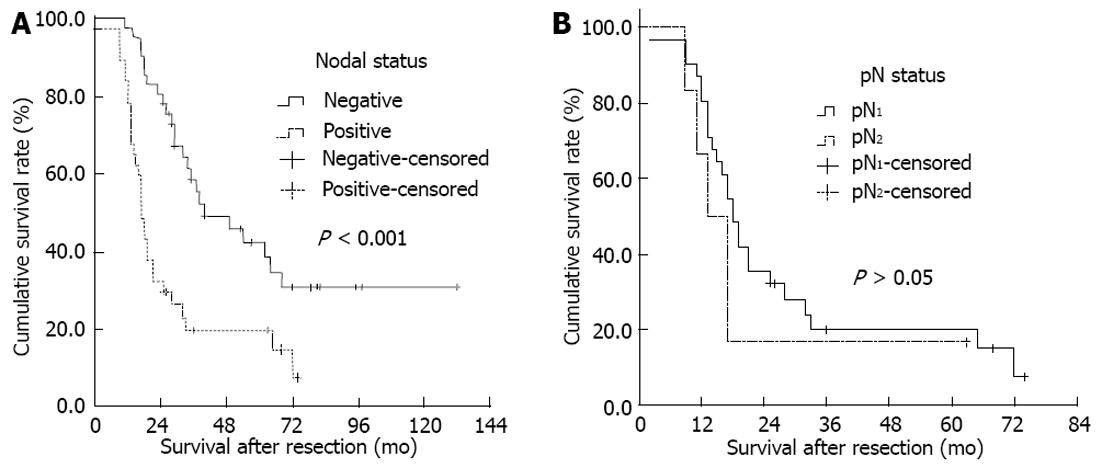
Figure 1 Kaplan-Meier survival estimates stratified.
A: Lymph node status (negative vs positive; median disease-specific survival, 40 mo vs 17 mo); B: pN status in nodal positive patients (pN1vs pN2; median disease-specific survival, 18 mo vs 13 mo).
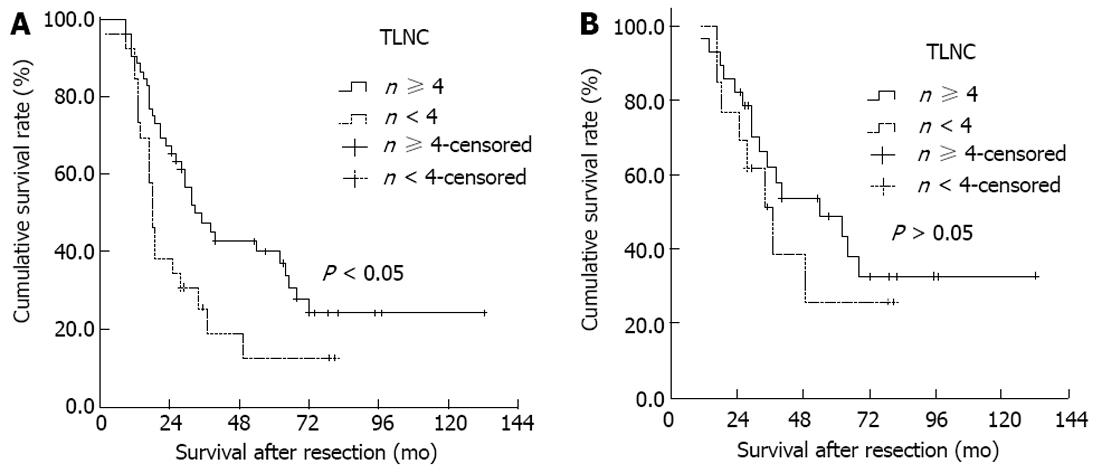
Figure 2 Kaplan-Meier survival estimates stratified for total lymph node count status (< 4 or ≥ 4, respectively).
A: In 78 patients who underwent an R0 resection (median disease-specific survival, 18 mo vs 33 mo); B: In 41 node-negative patients (median disease-specific survival, 37 mo vs 54 mo). TLNC: Total lymph node count.
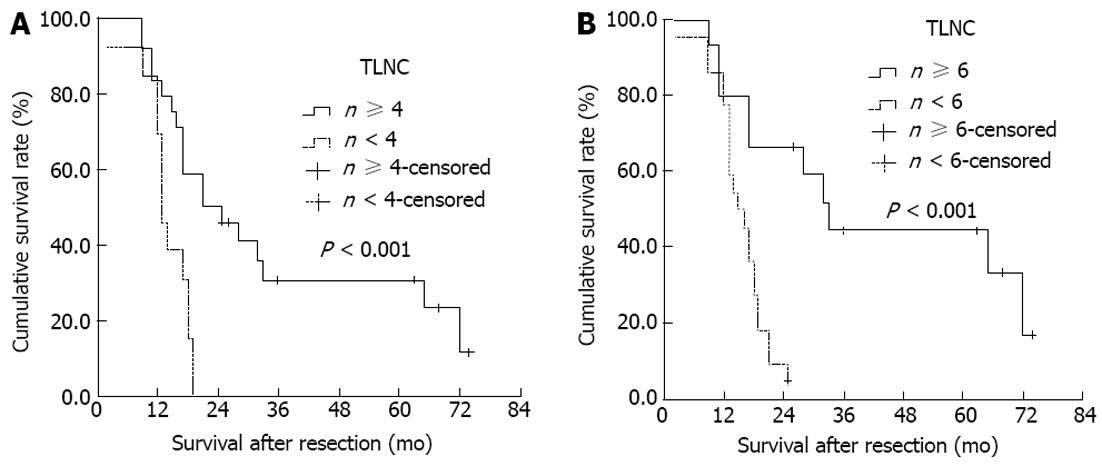
Figure 3 Kaplan-Meier survival estimates stratified for total lymph node count status in 37 node-positive patients.
A: n < 4 or ≥ 4, respectively; median disease-specific survival, 13 mo vs 21 mo; B: n < 6 or ≥ 6, respectively; median disease-specific survival, 15 mo vs 33 mo. TLNC: Total lymph node count.
- Citation: Liu GJ, Li XH, Chen YX, Sun HD, Zhao GM, Hu SY. Radical lymph node dissection and assessment: Impact on gallbladder cancer prognosis. World J Gastroenterol 2013; 19(31): 5150-5158
- URL: https://www.wjgnet.com/1007-9327/full/v19/i31/5150.htm
- DOI: https://dx.doi.org/10.3748/wjg.v19.i31.5150


