Copyright
©2013 Baishideng Publishing Group Co.
World J Gastroenterol. Jan 21, 2013; 19(3): 347-354
Published online Jan 21, 2013. doi: 10.3748/wjg.v19.i3.347
Published online Jan 21, 2013. doi: 10.3748/wjg.v19.i3.347
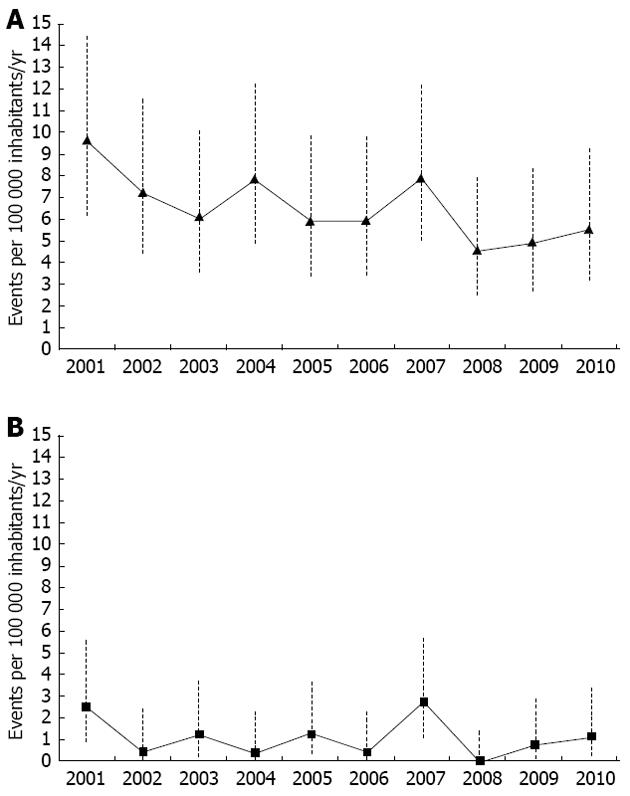
Figure 1 Incidence and mortality of perforated peptic ulcer from 2001-2010.
A: The incidence rates of perforated peptic ulcer (PPU) per 100 000 inhabitants per year, adjusted for age and gender; B: The mortality rate from PPU per 100 000 inhabitants per year, adjusted for age and gender.
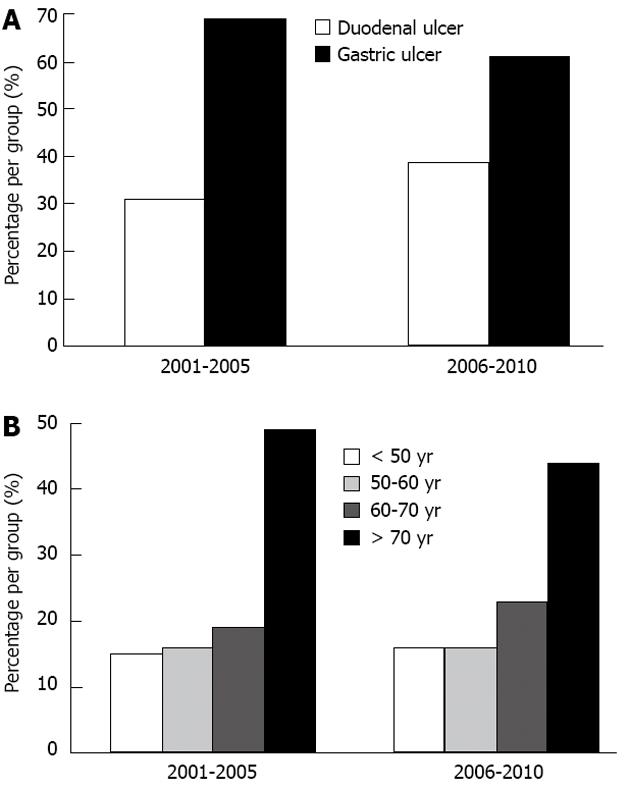
Figure 2 Localisation of ulcers and distribution of age-groups.
A: Perforated peptic ulcer (PPU) localisation with admission rates over time. The decade is divided in two periods from 2001-2005 and 2006-2010; B: PPU presentation according to age groups (age in years; < 50, 50-59, 60-69, > 70) divided into the two time periods.
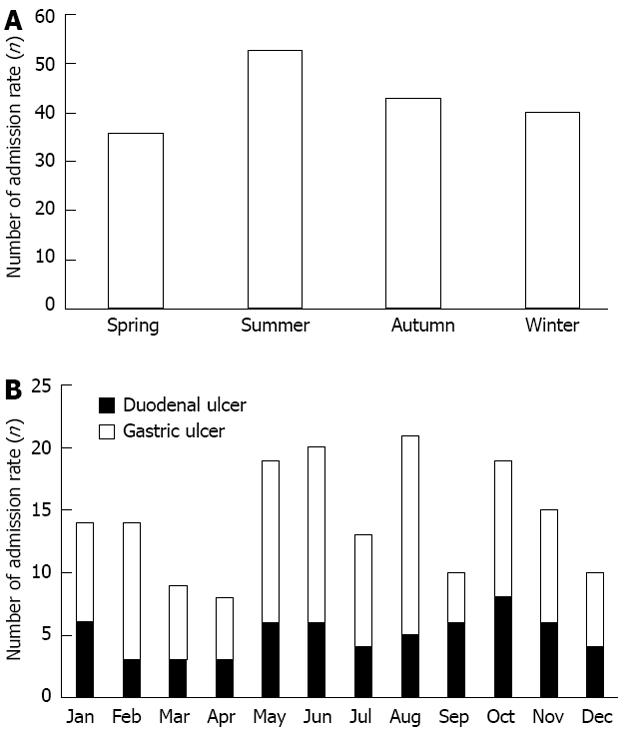
Figure 3 Seasonal and monthly variation in admissions.
A: Seasonal variation in admissions overall; B: The monthly variation in admissions with numbers for gastric and duodenal ulcers, respectively.
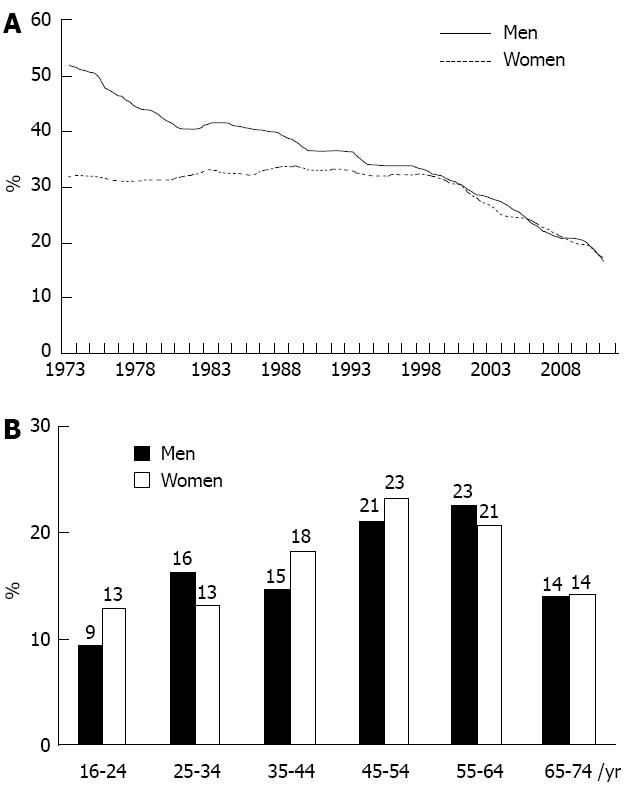
Figure 4 Change in prevalence of daily smokers in Norway.
A: The time trend of daily smokers over time in the Norwegian population aged between 16-74 years, showing a decline over time for each gender; B: The distribution of smokers according to age groups and gender for the fiscal year 2011. Data are reproduced and presented from the Norwegian Directorate of Health (http://www.helsedirektoratet.no, accessed October 5, 2012).
- Citation: Thorsen K, Søreide JA, Kvaløy JT, Glomsaker T, Søreide K. Epidemiology of perforated peptic ulcer: Age- and gender-adjusted analysis of incidence and mortality. World J Gastroenterol 2013; 19(3): 347-354
- URL: https://www.wjgnet.com/1007-9327/full/v19/i3/347.htm
- DOI: https://dx.doi.org/10.3748/wjg.v19.i3.347


