Copyright
©2012 Baishideng Publishing Group Co.
World J Gastroenterol. Dec 28, 2012; 18(48): 7319-7326
Published online Dec 28, 2012. doi: 10.3748/wjg.v18.i48.7319
Published online Dec 28, 2012. doi: 10.3748/wjg.v18.i48.7319
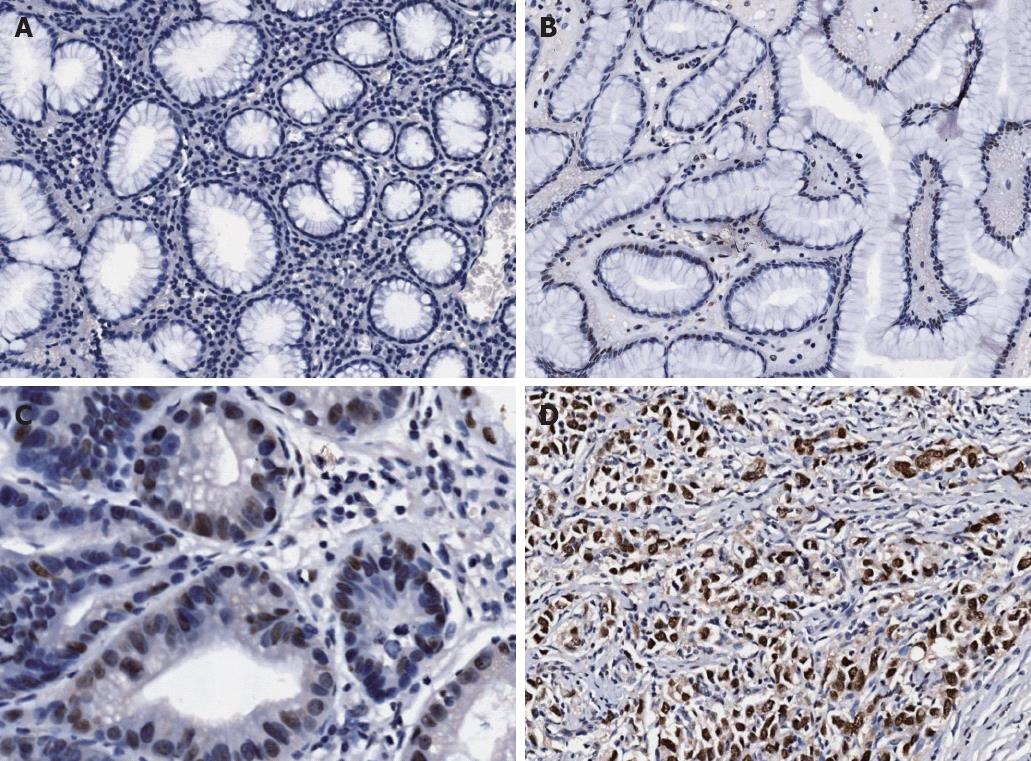
Figure 1 Expression of high mobility group-box 3 in gastric adenocarinoma tissue and peritumoral tissue.
A: Peritumoral tissue, no staining; B: Peritumoral tissue, weak staining; C: Gastric adenocarinoma tissue, weak staining; D: Gastric adenocarcinoma tissue, highly positive staining.
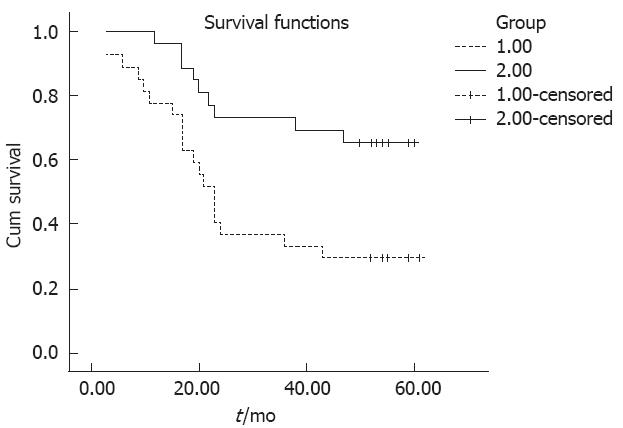
Figure 2 Kaplan-Meier survival curves between high mobility group-box 3 high expression group and low expression group (P = 0.
006, Mantel-cox). Group 1: High mobility group-box 3 (HMGB3) no or low expression; Group 2: HMGB3 overexpression.
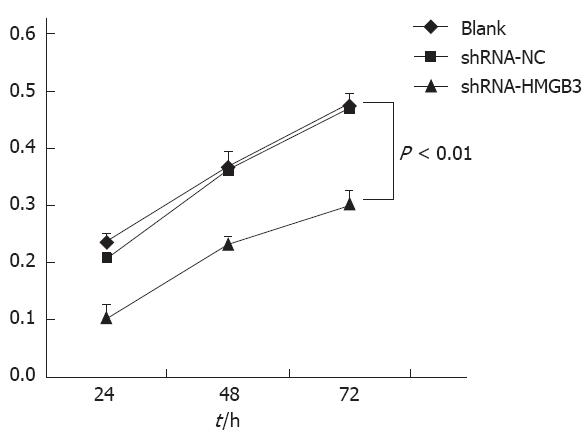
Figure 3 Effects of small hairpin RNAs-high mobility group-box 3 on BGC823 cell proliferation by MTT assay.
Data shown as mean ± SD. Experiment was performed in triplicate, P < 0.01 small hairpin RNAs-negative control (shRNAs-NC) vs shRNA-high mobility group-box 3 (HMGB3).
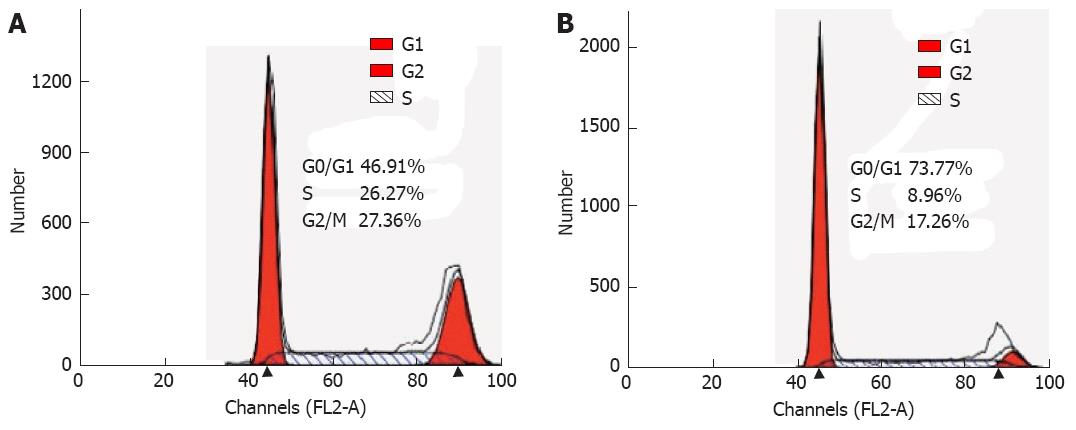
Figure 4 Flow cytometry analysis of cell cycle distribution in BGC823 cells after transfection of high mobility group-box 3 small hairpin RNA for 48 h.
A: Small hairpin RNAs (shRNA)-negative control; B: shRNA-high mobility group-box 3 group.
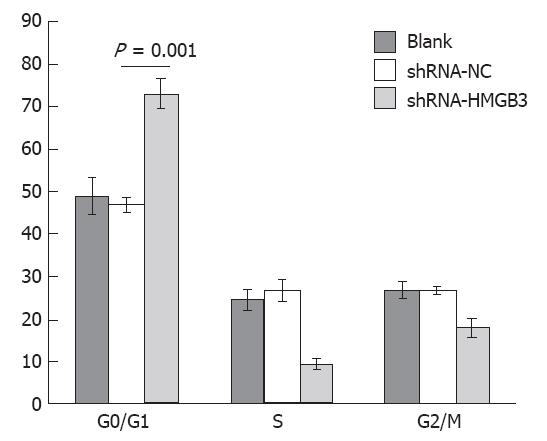
Figure 5 Cell cycle distribution in BGC823 cells after transfection of high mobility group-box 3 small hairpin RNA for 48 h.
Data shown as mean ± SD. Experiment was performed in triplicate, P = 0.001 between small hairpin RNAs-negative control (shRNAs-NC) and shRNA-high mobility group-box 3 (HMGB3).
- Citation: Tang HR, Luo XQ, Xu G, Wang Y, Feng ZJ, Xu H, Shi YW, Zhang Q, Wu LG, Xue CQ, Wang CW, Wu CY. High mobility group-box 3 overexpression is associated with poor prognosis of resected gastric adenocarcinoma. World J Gastroenterol 2012; 18(48): 7319-7326
- URL: https://www.wjgnet.com/1007-9327/full/v18/i48/7319.htm
- DOI: https://dx.doi.org/10.3748/wjg.v18.i48.7319


