Copyright
©2012 Baishideng Publishing Group Co.
World J Gastroenterol. Jan 28, 2012; 18(4): 309-322
Published online Jan 28, 2012. doi: 10.3748/wjg.v18.i4.309
Published online Jan 28, 2012. doi: 10.3748/wjg.v18.i4.309
Figure 1 E15 rat hepatocytes in vitro.
A: E15 rat hepatocytes 2 d after cell inoculation; B: E15 rat hepatocytes 2 d following cell inoculation; C: Differentiation of rat embryonic hepatocytes. Scale bars: 20 μm.
Figure 2 Immunohistochemistry staining of E15 rat hepatocytes.
A: c-kit-positive colony; B: c-Met-positive colony; C: Nestin-positive colony; D: α-fetoprotein-positive colony; E: Albumin-positive colony; F: Cytokeratin 19-positive colony. Scale bars: 20 μm.
Figure 3 Parameters of ultrasound examination.
A: Livers exhibit a smooth capsule, sharp edges, clear vascular texture and uniform echoes in the normal control group; B: Livers from rats of the untreated cirrhotic group exhibit uneven surfaces, blunt edges, unclear vascular texture and serrated and enhanced echoes with uneven distribution; C: In the transplantation group, rat livers exhibit a smooth capsule, smooth edges, clear vascular texture and even echo patterns.
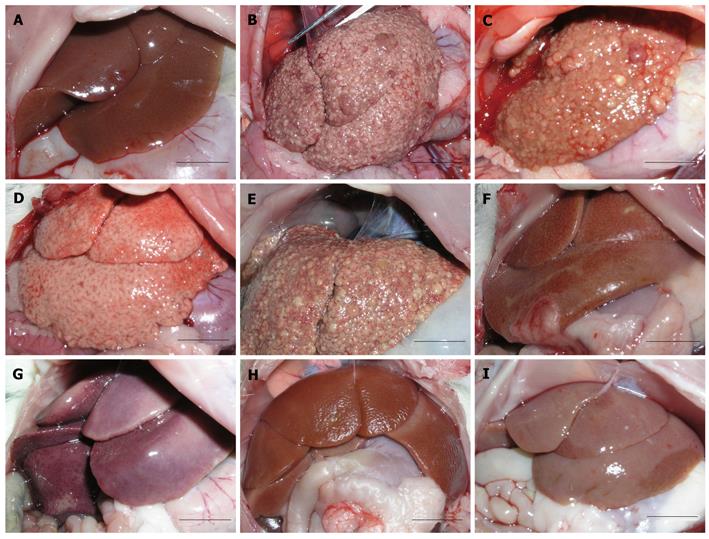
Figure 4 The appearance of rat livers.
A: Normal control group; B-E: Untreated cirrhotic group; F-I: Transplantation group. Scale bars: 1 cm.
Figure 5 Tracking E15 hepatocytes.
A: Using fluorescence microscopy, in vitro E15 hepatocytes demonstrated strong green fluorescence 2 d into the culture period with the carboxyfluorescein diacetate and succinimidyl ester fluorescent label; B: Cells in frozen liver tissue sections (2 wk following transplantation); scattered green fluorescent markers were observed; C: No fluorescent cells were observed in the frozen liver tissue sections of the untreated cirrhotic group. Scale bars: 20 μm.
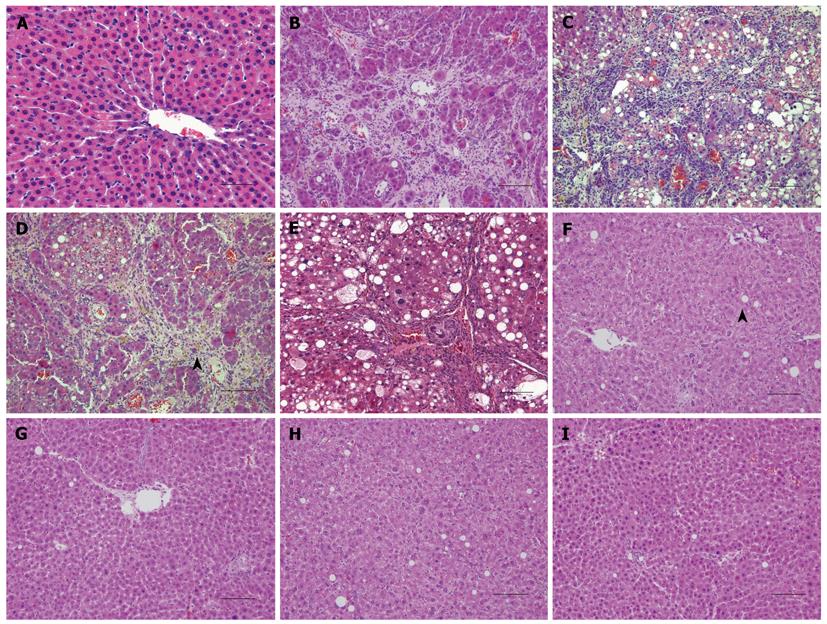
Figure 6 Hematoxylin and eosin staining of tissue slices from rat livers in each group.
A: Normal liver lobules from the normal control group; B-E: Pseudo-lobules, fatty degeneration, necrotic hepatocytes, brown pigmentation (arrow) in livers from the untreated cirrhotic group; F-I: Sections from the cell transplantation group; a few cells have vacuoles (arrow), and liver lobules are present. Scale bars: 20 μm.
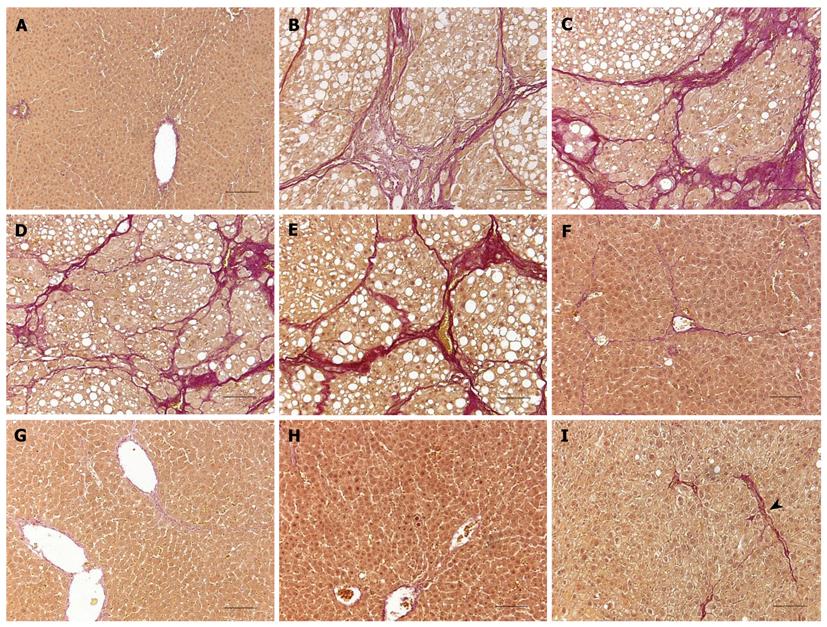
Figure 7 Van gieson staining of tissue slices from rat livers in each group.
A: No hyperplasia of the fibrous tissue was observed in the normal control group; B-E: Pseudo-lobules were surrounded by fibrous tissues in livers from the untreated cirrhotic group; F-I: A few collagen fibers (arrow) were observed in livers from the transplantation group. Scale bars: 20 μm.
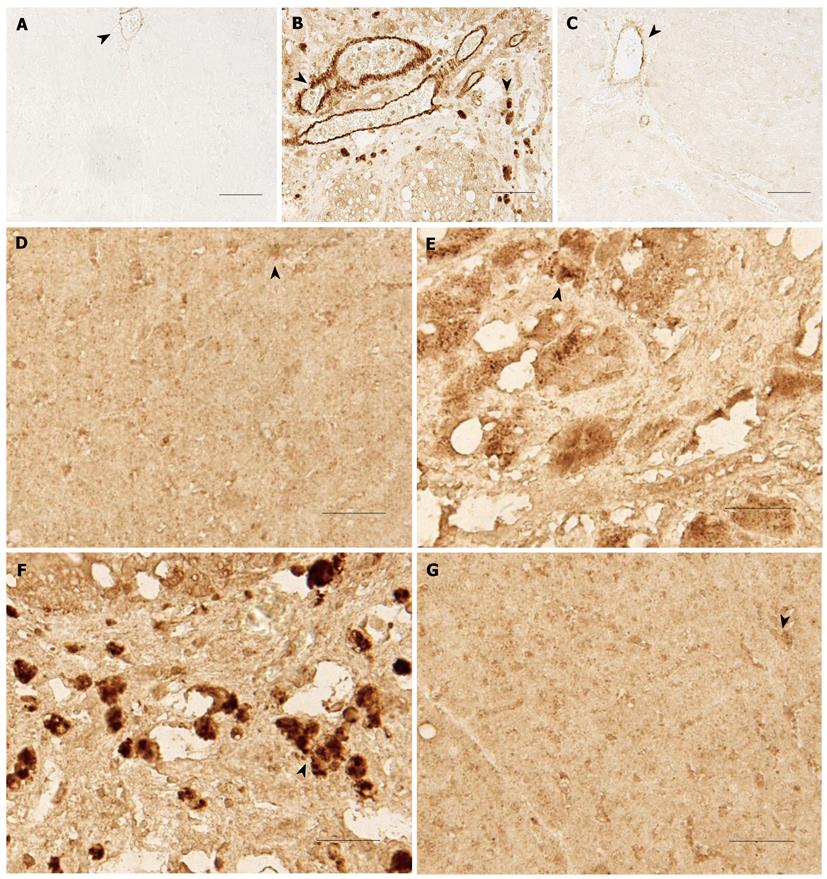
Figure 8 Immunohistochemical staining of rat livers in each group.
A: α smooth muscle actin (α-SMA) expression (arrow) was only observed in the vascular wall of the normal group; B: α-SMA (arrow) was highly expressed in the periportal areas and fibrous septa of livers from the untreated cirrhotic group; C: The cell transplantation group exhibited noticeably weaker α-SMA (arrow) expression than the untreated cirrhotic group; D: Weak endothelin-1 (ET-1) (arrow) expression was detected in a few sinusoid endothelial cells of livers from the normal control group; E: Clear ET-1 expression (arrow) was observed in the pseudo-lobules of livers from the untreated cirrhotic group; F: Clear ET-1 (arrow) expression in the fibrous septa of livers from the untreated cirrhotic group; G: In the cell transplantation group, ET-1 (arrow) expression was only observed in the sinusoid endothelial cells. Scale bars: 20 μm.
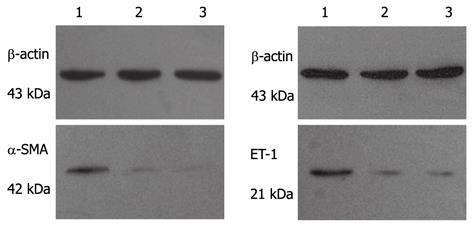
Figure 9 Western blotting analysis of α smooth muscle actin and endothelin-1 expression in liver tissues.
Lane 1: The untreated cirrhotic group; Lane 2: The cell transplantation group; Lane 3: The normal control group. SMA: Smooth muscle actin. ET-1: Endothelin-1.
- Citation: Bin WT, Ma LM, Xu Q, Shi XL. Embryonic hepatocyte transplantation for hepatic cirrhosis: Efficacy and mechanism of action. World J Gastroenterol 2012; 18(4): 309-322
- URL: https://www.wjgnet.com/1007-9327/full/v18/i4/309.htm
- DOI: https://dx.doi.org/10.3748/wjg.v18.i4.309


