Copyright
©2012 Baishideng Publishing Group Co.
World J Gastroenterol. Mar 14, 2012; 18(10): 1028-1037
Published online Mar 14, 2012. doi: 10.3748/wjg.v18.i10.1028
Published online Mar 14, 2012. doi: 10.3748/wjg.v18.i10.1028
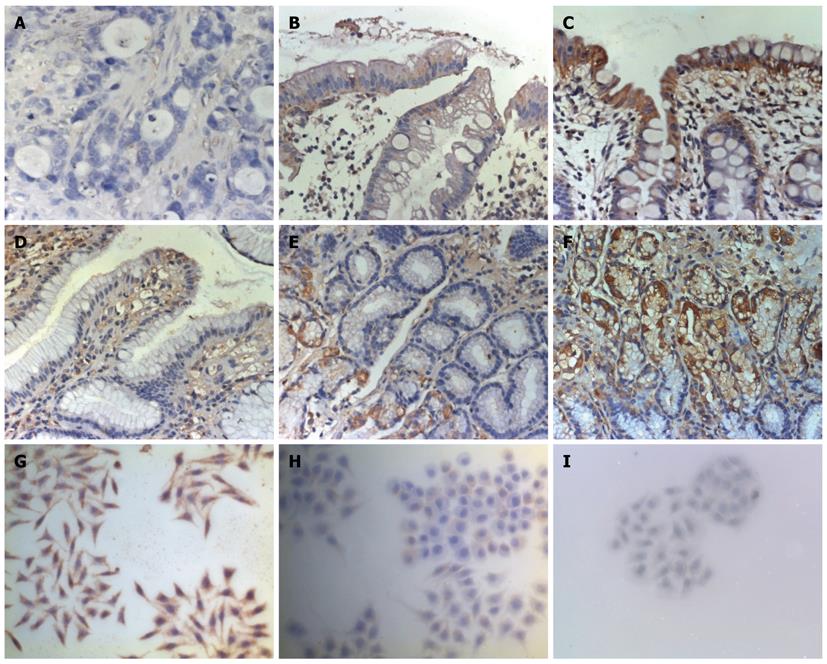
Figure 1 Immunohistochemistry image of 15-hydroxyprostaglandin dehydrogenase (400 ×).
A: Gastric cancer (IHC Score 1.20 ± 1.13, P < 0.01 vs B, C and F); B and C: Paracancerous tissue 3 cm (6.83 ± 2.78, P < 0.01 vs C and F) and 6 cm (10.20 ± 1.92) distant from tumor; D: Gastric polyps (6.00 ± 2.74, P < 0.01 vs F); E: Atrophic gastritis (5.14 ± 1.57, P < 0.05 vs F); F: Normal gastric tissues (11.00 ± 1.63). G: MKN-28 (3.31 ± 0.92, P < 0.05 vs H and I); H: MKN-45 (1.29 ± 0.48); I: SGC-7901 (absent).
Figure 2 Expression of 15-hydroxyprostaglandin dehydrogenase mRNA in gastric cancer tissue, paracancenous tissue, gastric polyps, atmphic gastritis, gastric cancer cell lines and normal gastric tissue by reverse transcriptase polymerase chain reaction.
Lane M: DNA marker; 1: Gastric cancer (0.21 ± 0.23, P < 0.01 vs 2, 3 and 4); 2 and 3: Paracancerous tissue 3 cm (0.56 ± 0.45) and 6 cm distant from tumor (0.81 ± 0.43); 4, 6 and 8: Normal gastric tissue (0.82 ± 0.31); 5: Gastric polyps (0.44 ± 0.21); 7: Atrophic gastritis (0.48 ± 0.19); 9: MKN-28 (0.31 ± 0.04, P < 0.01 vs 10 and 11); 10: MKN-45 (0.08 ± 0.01, P < 0.01 vs 11 ); 11: SGC-7901 (absent). 15-PGDH: 15-hydroxyprostaglandin dehydrogenase; GAPDH: Glyceraldehyde-3-phosphate dehydrogenase.
Figure 3 Expressions of 15-hydroxyprostaglandin dehydrogenase in gastric cancer tissue, paracancenous tissue, gastric polyps, atmphic gastritis, gastric cancer cell lines and normal gastric tissue by Western blotting.
1-3: Gastric cancer, paracancerous tissue 3 cm and 6 cm from the same case; 4: Gastric polyps; 5: Atrophic gastritis; 6: Normal gastric tissue; 7: MKN-28; 8: MKN-45; 9: SGC-7901. 15-PGDH: 15-hydroxyprostaglandin dehydrogenase.
Figure 4 Expressions of 15-hydroxyprostaglandin dehydrogenase in SGC-7901 cells before and after transfected by pcDNA3/15-hydroxyprostaglandin dehydrogenase plasmid.
A: Reverse transcriptase polymerase chain reaction image of 15-hydroxyprostaglandin dehydrogenase (15-PGDH) and GAPDH. Lane M: DNA marker; 1: SGC-7901; 2: pcDNA3 24 h group; 3: pcDNA3/15-PGDH 24 h group; 4: pcDNA3 48 h group; 5: pcDNA3/15-PGDH 48 h group; B: Western blotting image of 15-PGDH and actin. 1: SGC-7901; 2: pcDNA3 36 h group; 3: pcDNA3/15-PGDH 36 h group. GAPDH: Glyceraldehyde-3-phosphate dehydrogenase.
Figure 5 Flow cytometry results of gastric cancer cell cycle.
A: SGC-7901; B: pcDNA3 24 h group; C: pcDNA3/15-PGDH 24 h group; D: pcDNA3 48 h group; E: pcDNA3/15-PGDH 48 h group. aP < 0.05 vs A, B and D.
Figure 6 Transmission electron microscopy of gastric cancer cell apoptosis (5000 ×).
A: Normal configuration of SGC-7901 cell; B: Normal configuration of cell in pcDNA3 24 h group; C: Apoptotic cell in pcDNA3/15-PGDH 24 h group; D: Normal configuration of cell in pcDNA3 48 h group; E: Apoptotic cell in pcDNA3/15-PGDH 48 h group.
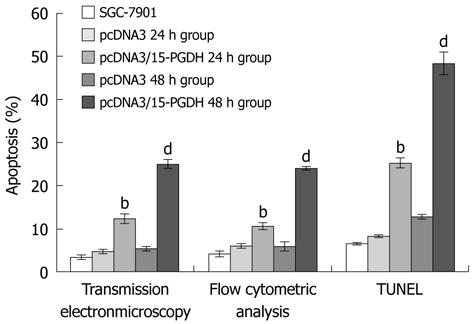
Figure 7 Induction of apoptosis in SGC-7901 cell line.
There was a significant apoptosis in erlotinib pcDNA3/15-hydroxyprostaglandin dehydrogenase (15-PGDH) 24 h and 48 h groups in transmission electronmicroscopy, flow cytometry analysis and TUNEL assay. bP < 0.01 vs SGC-7901, pc DNA3 24 h and 48 h group; dP < 0.01 vs SGC-7901, pcDNA3/15-PGDH 24 h group, pc DNA3 24 h and 48 h group.
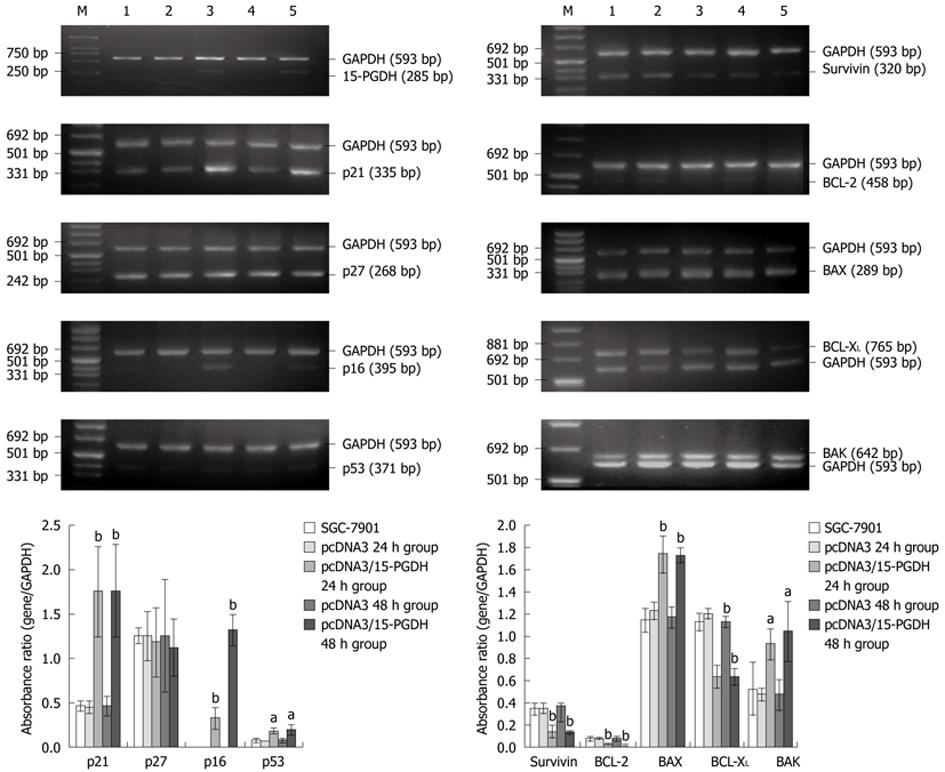
Figure 8 Expressions of 15-PGDH, p21, p27, p16, p53, Survivin, BCL-2, BAX, BAK and BCL-XL mRNA in SGC-7901 cells transfected by pcDNA3/15-PGDH plamids for 24 h and 48 h by reverse transcriptase polymerase chain reaction.
Lane M: DNA marker; 1: SGC-7901; 2: pcDNA3 24 h group; 3: pcDNA3/15-PGDH 24 h group; 4: pcDNA3 48 h group; 5: pcDNA3/15-PGDH 48 h group. aP < 0.05, bP < 0.01 vs SGC-7901, pc DNA3 24 h and 48 h group.
- Citation: Lou LH, Jing DD, Lai YX, Lu YY, Li JK, Wu K. 15-PGDH is reduced and induces apoptosis and cell cycle arrest in gastric carcinoma. World J Gastroenterol 2012; 18(10): 1028-1037
- URL: https://www.wjgnet.com/1007-9327/full/v18/i10/1028.htm
- DOI: https://dx.doi.org/10.3748/wjg.v18.i10.1028


