Copyright
©2011 Baishideng Publishing Group Co.
World J Gastroenterol. Mar 7, 2011; 17(9): 1135-1142
Published online Mar 7, 2011. doi: 10.3748/wjg.v17.i9.1135
Published online Mar 7, 2011. doi: 10.3748/wjg.v17.i9.1135
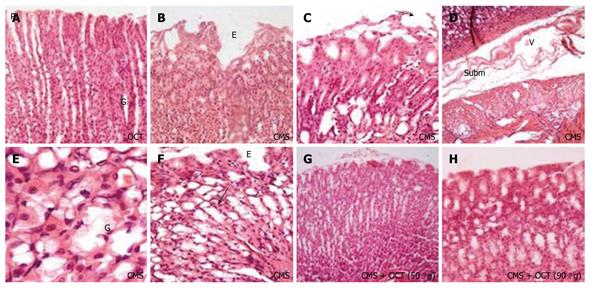
Figure 1 Representative photomicrographs of stomach fundus mucosa obtained at the beginning of the following dark cycle after last exposure to mild stressors with or in absence of octreotide (50 and 90 μg/kg, ip) treatment.
A: Octreotide (OCT) administered to normal rats showing normal gastric architecture with gastric pits (P) and gastric glands (G); B: Chronic mild stress (CMS) sections showing mucosal erosion designated by letter E; C: CMS showing hydropic degeneration with erosion and epithelial desquamation (arrow); D: CMS with submucosal edema (V) as represented by wide separation of connective tissue between mucosa and muscularis mucosa infiltrated macrophages and eosinophils (E); E: CMS showing goblet cell (G) metaplasia indicative of mucous secretion and increase in activity of mucous secretion due to fasting, irritation and stress; F: CMS showing surface erosions (E) and marked goblet cell metaplasia with inflammatory cell infiltration (arrow) in the deep mucosa; G and H: Improvement of epithelial lining as indication for surface regeneration with OCT at both dose levels in CMS rats (HE stain, × 40 and 100).
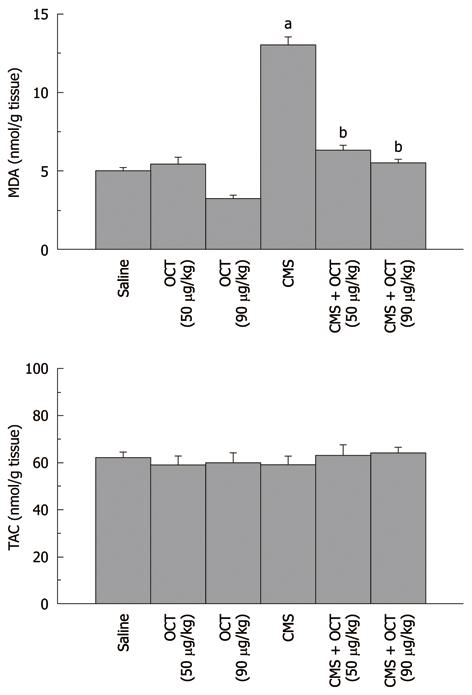
Figure 2 Effect of octreotide (50 and 90 μg/kg, ip) given 2 h prior to chronic mild stress exposure on mucosal malondialdehyde content (upper panel) and total antioxidant capacity (lower panel) in normal rats and those subjected to chronic mild stress.
Values are mean ± SE, n = 6-8 each. a,bP < 0.05 vs control and chronic mild stress (CMS), respectively, using one-way ANOVA followed by Tukey-Kramer Multiple Comparisons Test. OCT: Octreotide; MDA: Malondialdehyde content; TAC: Total antioxidant capacity.
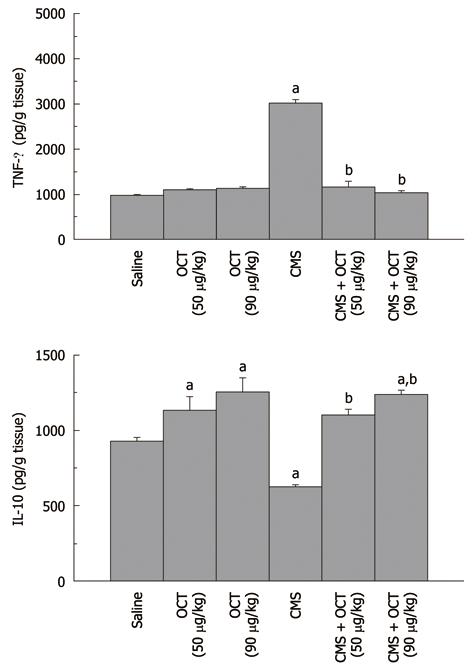
Figure 3 Effect of octreotide (50 and 90 μg/kg, ip) on gastric mucosal tumor necrosis factor-α (upper panel) and interleukin-10 (lower panel) content in normal rats and those subjected to chronic mild stress, where octreotide was administered 2 h before chronic mild stress exposure.
Values are mean ± SE, n = 6-8 each. a,bP < 0.05 vs control and chronic mild stress (CMS), respectively, using one-way ANOVA followed by Tukey-Kramer Multiple Comparisons Test. OCT: Octreotide; TNF: Tumor necrosis factor; IL: Interleukin.
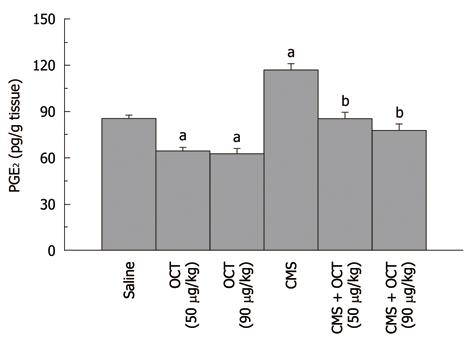
Figure 4 Effect of octreotide (50 and 90 μg/kg, ip) on gastric mucosal PGE2 content in normal rats and those subjected to chronic mild stress (mean of 6-8 animals ± SE).
Octreotide was administered 2 h before chronic mild stress (CMS) exposure. a,bP < 0.05 vs control and CMS, respectively, using one-way ANOVA followed by Tukey-Kramer Multiple Comparisons Test. OCT: Octreotide.
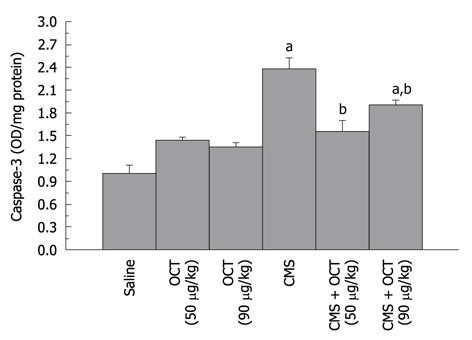
Figure 5 Effect of octreotide (50 and 90 μg/kg, ip) on gastric mucosal caspase-3 activity in normal rats and those subjected to chronic mild stress (mean of 6-8 animals ± SE).
Octreotide was administered 2 h before chronic mild stress (CMS) exposure. a,bP < 0.05 vs control and CMS, respectively, using one-way ANOVA followed by Tukey-Kramer Multiple Comparisons Test. OCT: Octreotide.
- Citation: Nassar NN, Schaalan MF, Zaki HF, Abdallah DM. Octreotide ameliorates gastric lesions in chronically mild stressed rats. World J Gastroenterol 2011; 17(9): 1135-1142
- URL: https://www.wjgnet.com/1007-9327/full/v17/i9/1135.htm
- DOI: https://dx.doi.org/10.3748/wjg.v17.i9.1135


