Copyright
©2011 Baishideng Publishing Group Co.
World J Gastroenterol. Nov 14, 2011; 17(42): 4729-4733
Published online Nov 14, 2011. doi: 10.3748/wjg.v17.i42.4729
Published online Nov 14, 2011. doi: 10.3748/wjg.v17.i42.4729
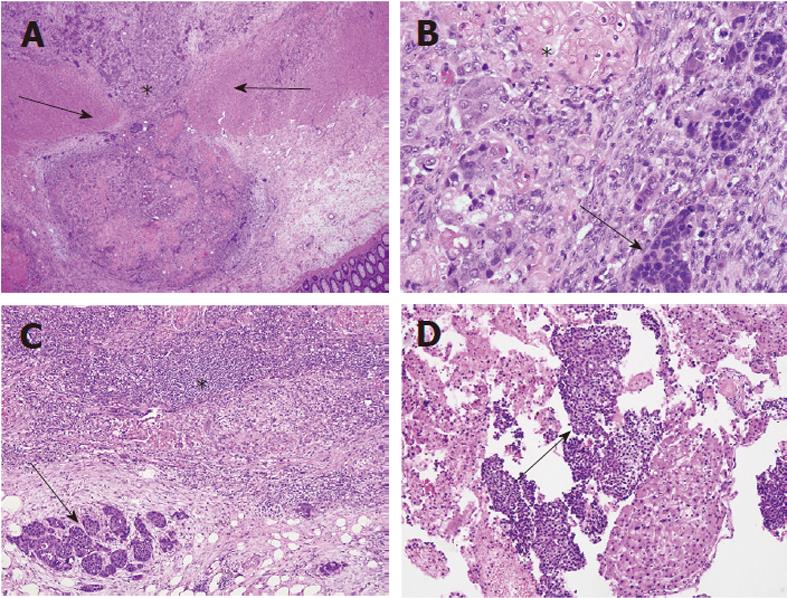
Figure 1 Hematoxylin and eosin-stained sections of tumor.
A: The tumor (asterisk) is submucosal with extension through inner and outer muscularis propria (arrows), 100 ×; B: Intimate mixing of squamous (asterisk) and neuroendocrine (arrow) components, 400 ×; C: Lymph node metastasis of both components (squamous, asterisk; neuroendocrine, arrow), 100 ×; D: Liver fine needle aspirate showing predominantly neuroendocrine cells (arrow) with background bland hepatocytes, 200 ×.
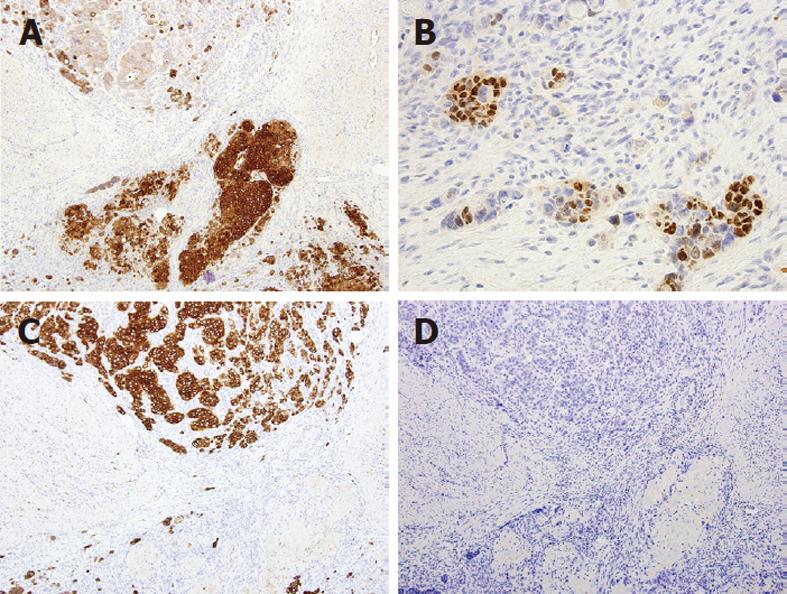
Figure 2 Immunohistochemical profile of the surgical resection specimen.
A: Cytokeratin AE1/AE3; B: Synaptophysin; C: CDX2; D: CK20. A, B and D at 100 ×, C at 400 ×.
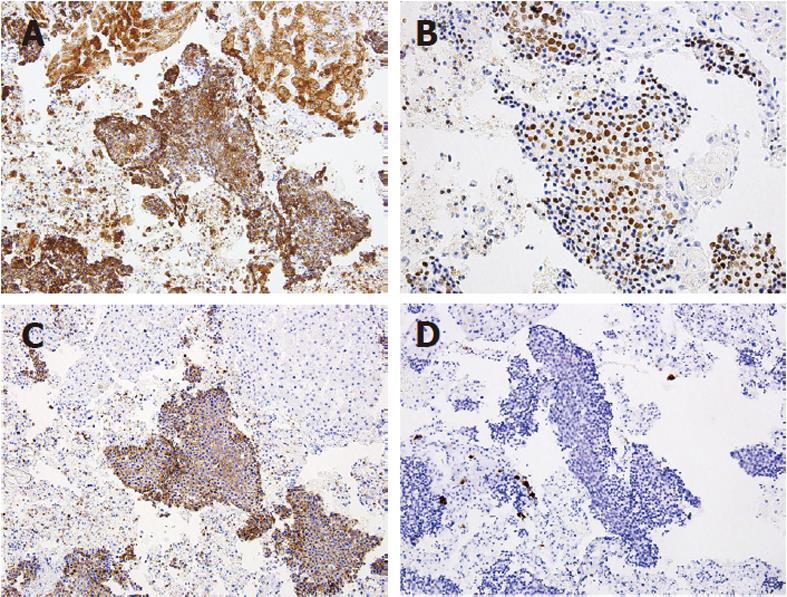
Figure 3 Immunohistochemical profile of the liver biopsy specimen.
A: Cytokeratin AE1/AE3; B: Synaptophysin; C: CDX2; D: CK20. A, B and D at 200 ×, C at 400 ×.
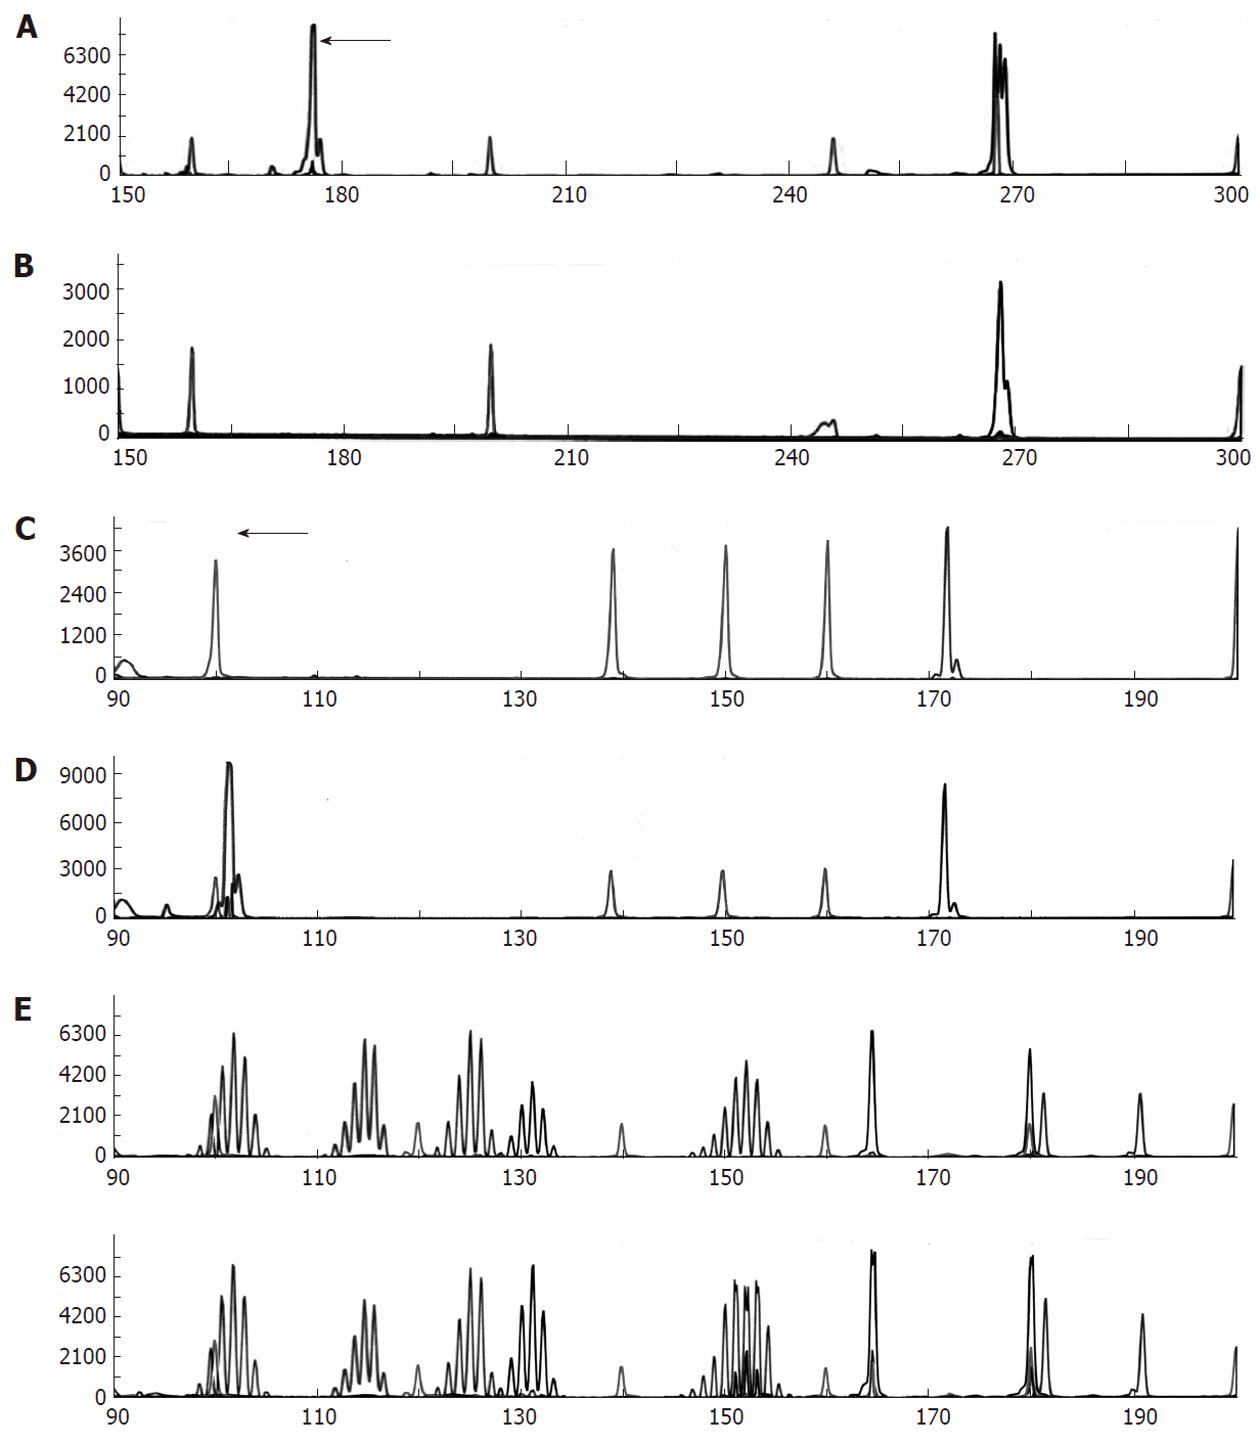
Figure 4 Molecular analysis.
A, B: KRAS mutation analysis; A: The peak at 176 bp (arrow) corresponds to the G13D mutation; B: Absent peak in the G12D mutation analysis (internal size standards at 160, 200, 248 and 300 bp; internal control amplicon peak at 267 bp for A and B); C, D: BRAF V600E mutation analysis; C: The tumor is negative for the BRAF V600E mutation as shown by the absence of a peak at 101 bp (arrow); D: BRAF V400E positive control with peak at 101 bp (internal size standards at 100, 140, 150, 160 and 200 bp; internal control amplicon peak at 171 bp for C and D); E: Microsatellite instability testing demonstrates a microsatellite-stable tumor, top; normal tissue, bottom (internal size standards at 120, 140, 160 and 200 bp).
- Citation: Wentz SC, Vnencak-Jones C, Chopp WV. Neuroendocrine and squamous colonic composite carcinoma: Case report with molecular analysis. World J Gastroenterol 2011; 17(42): 4729-4733
- URL: https://www.wjgnet.com/1007-9327/full/v17/i42/4729.htm
- DOI: https://dx.doi.org/10.3748/wjg.v17.i42.4729


