Copyright
©2010 Baishideng Publishing Group Co.
World J Gastroenterol. Nov 14, 2010; 16(42): 5359-5366
Published online Nov 14, 2010. doi: 10.3748/wjg.v16.i42.5359
Published online Nov 14, 2010. doi: 10.3748/wjg.v16.i42.5359
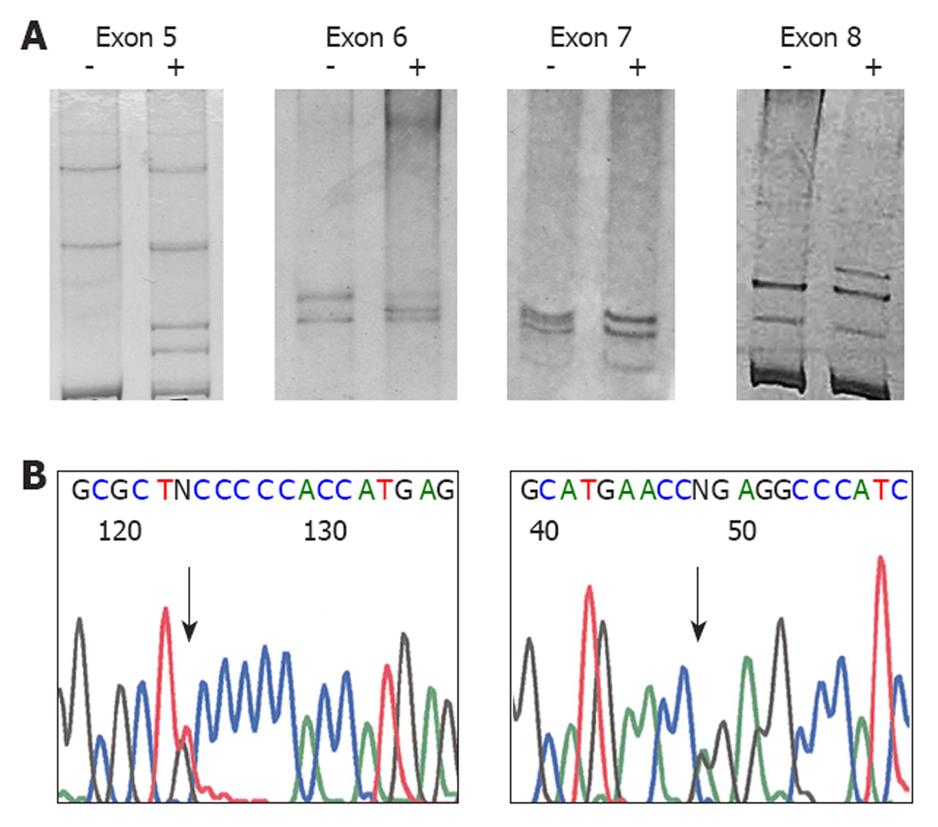
Figure 1 Single-strand conformation polymorphism analysis and direct sequencing of p53.
A: Single-strand conformation polymorphism of p53, exons 5-8 in representative positive cases (+), which showed anomalous bands compared to normal bands in negative cases (-); B: Sequencing chromatograms that represent case E355 (left), which shows TGC-> TTC mutation at codon 176 (arrow) and case E106 (right), which shows CGG-> CAG at codon 248 (arrow).
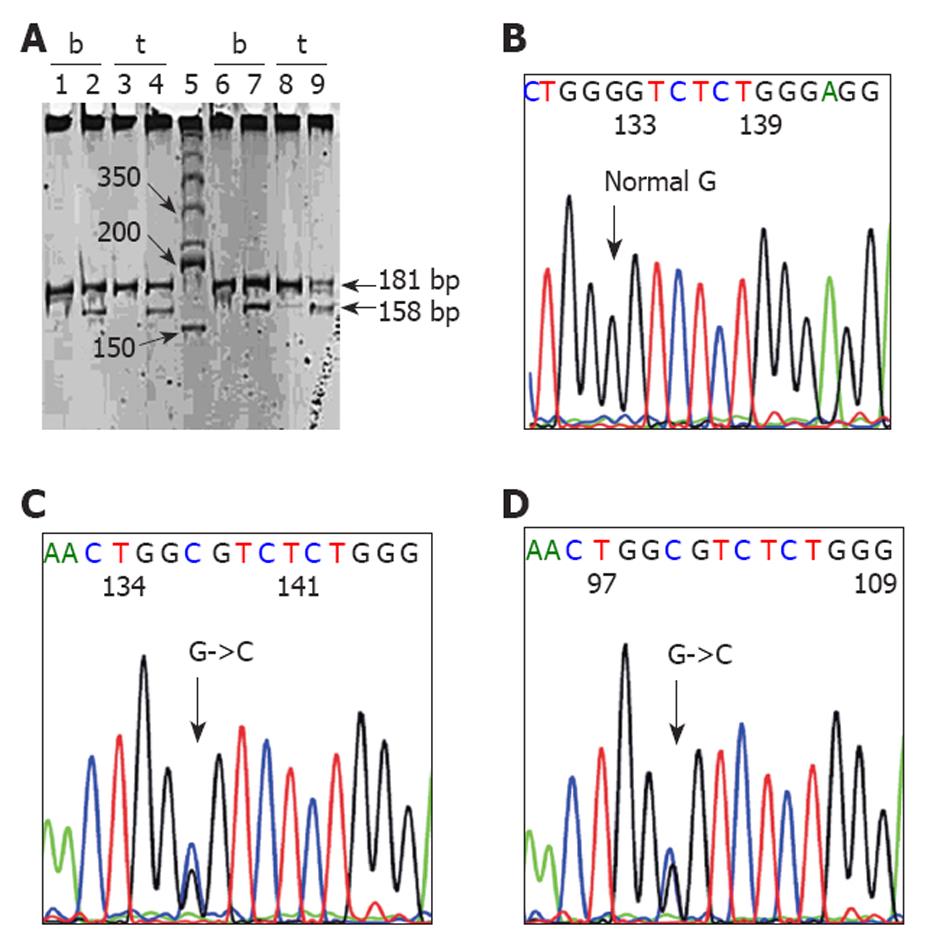
Figure 2 Restriction fragment length polymorphism analysis and direct sequencing to detect intron 6 mutation.
A: Detection of the G to C substitution at base 18 after the end of exon 6 by polymerase chain reaction-restriction fragment length polymorphism using BsaHI restriction enzymes. Lane 5 is the size marker. Lanes 1, 3, 6, 8 are uncut 181 bp products of blood (b) and tumor (t) samples of E189 and E199, respectively. Lanes 2, 4, 7, 9 are cut products of the corresponding samples, which show 181 bp and 158 bp fragments, which indicate the presence of a mutation. The 23-bp fragment was not detected in this gel; B-D: Sequencing chromatograms of the corresponding site. Normal sample (B); tumor (C) and blood (D) samples show G to C substitution.
-
Citation: Thongsuksai P, Boonyaphiphat P, Puttawibul P, Sudhikaran W. Specific intronic
p53 mutation in esophageal squamous cell carcinoma in Southern Thailand. World J Gastroenterol 2010; 16(42): 5359-5366 - URL: https://www.wjgnet.com/1007-9327/full/v16/i42/5359.htm
- DOI: https://dx.doi.org/10.3748/wjg.v16.i42.5359


