Copyright
copy;2010 Baishideng Publishing Group Co.
World J Gastroenterol. Oct 21, 2010; 16(39): 5005-5008
Published online Oct 21, 2010. doi: 10.3748/wjg.v16.i39.5005
Published online Oct 21, 2010. doi: 10.3748/wjg.v16.i39.5005
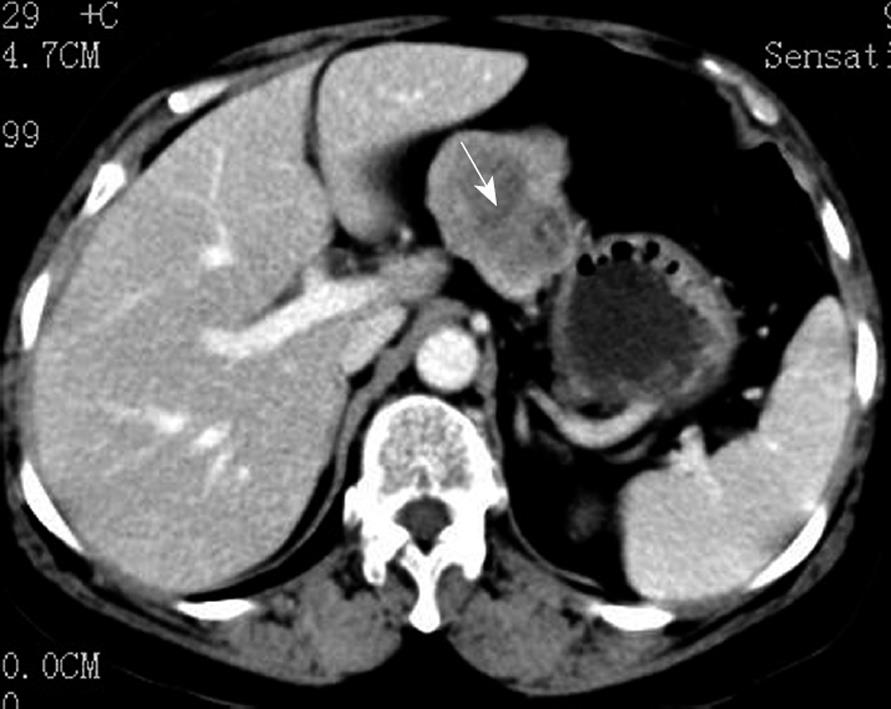
Figure 1 Computed tomography scan demonstrating a soft tissue mass (arrow) near the lesser curvature of the gastric body.
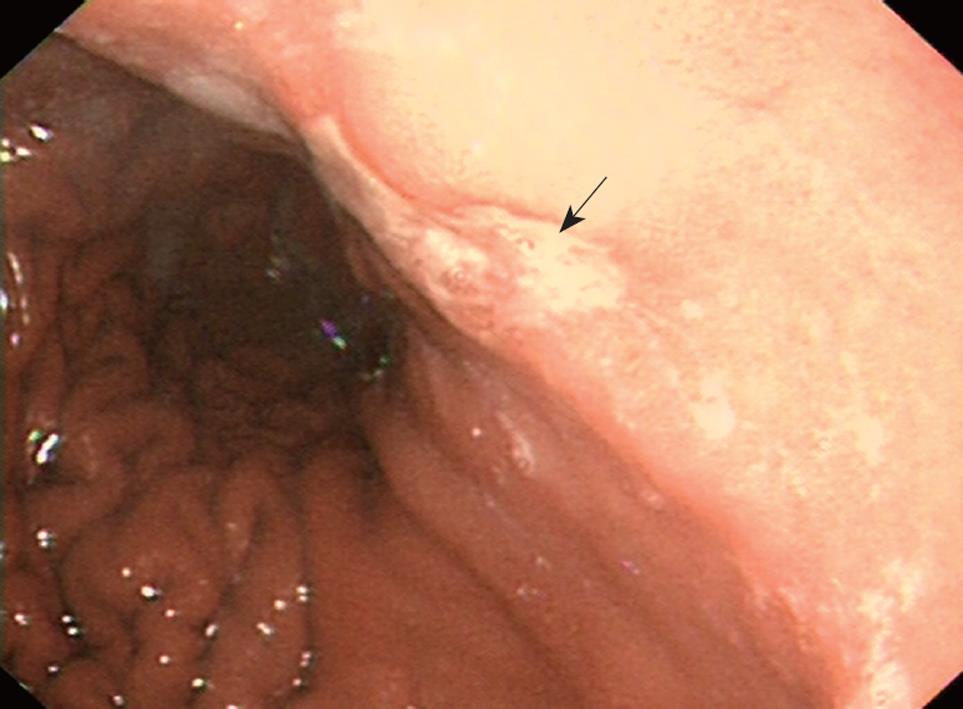
Figure 2 Gastroscopy revealing a mucosal ulcer (arrow) located in the lesser curvature.
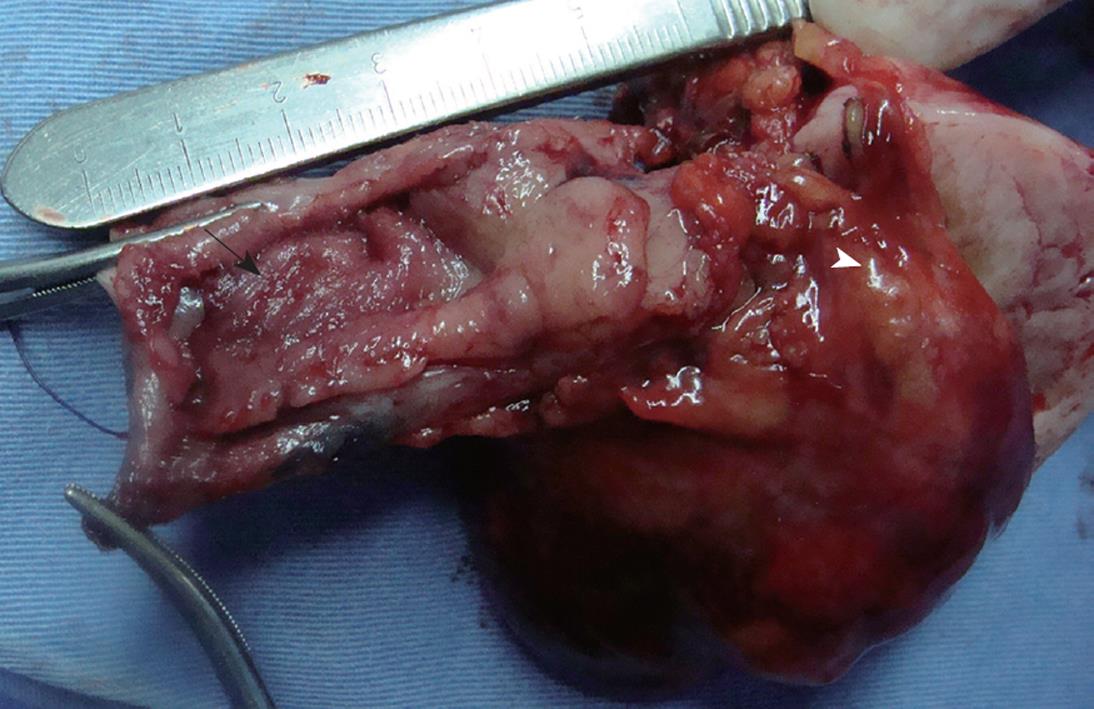
Figure 3 Resected specimens of mucosal ulcer (arrow) and GIST (arrowhead).
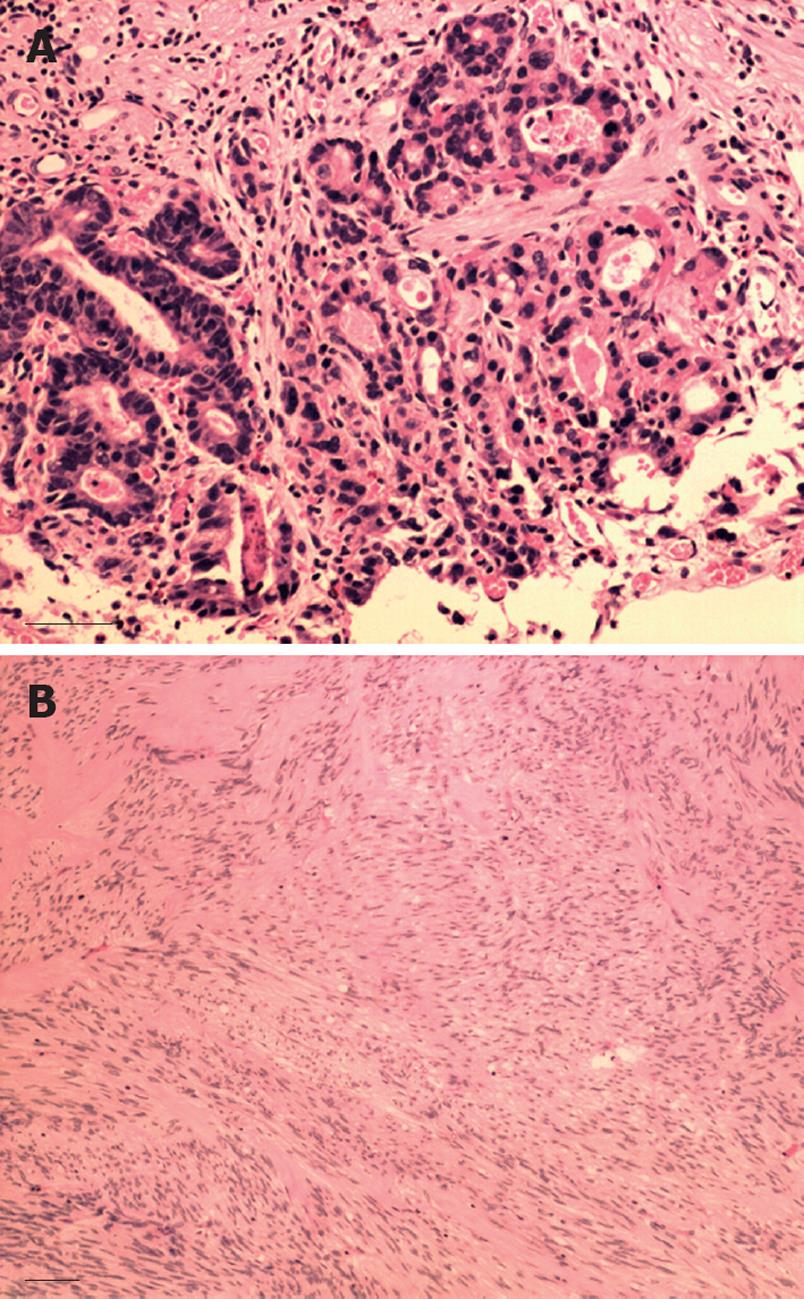
Figure 4 Histological features of high-level intraepithelial neoplasia (A) (HE stain, 200 ×) and gastrointestinal stromal tumor (B) (HE stain, 100 ×).
Scale bar = 100 μm.
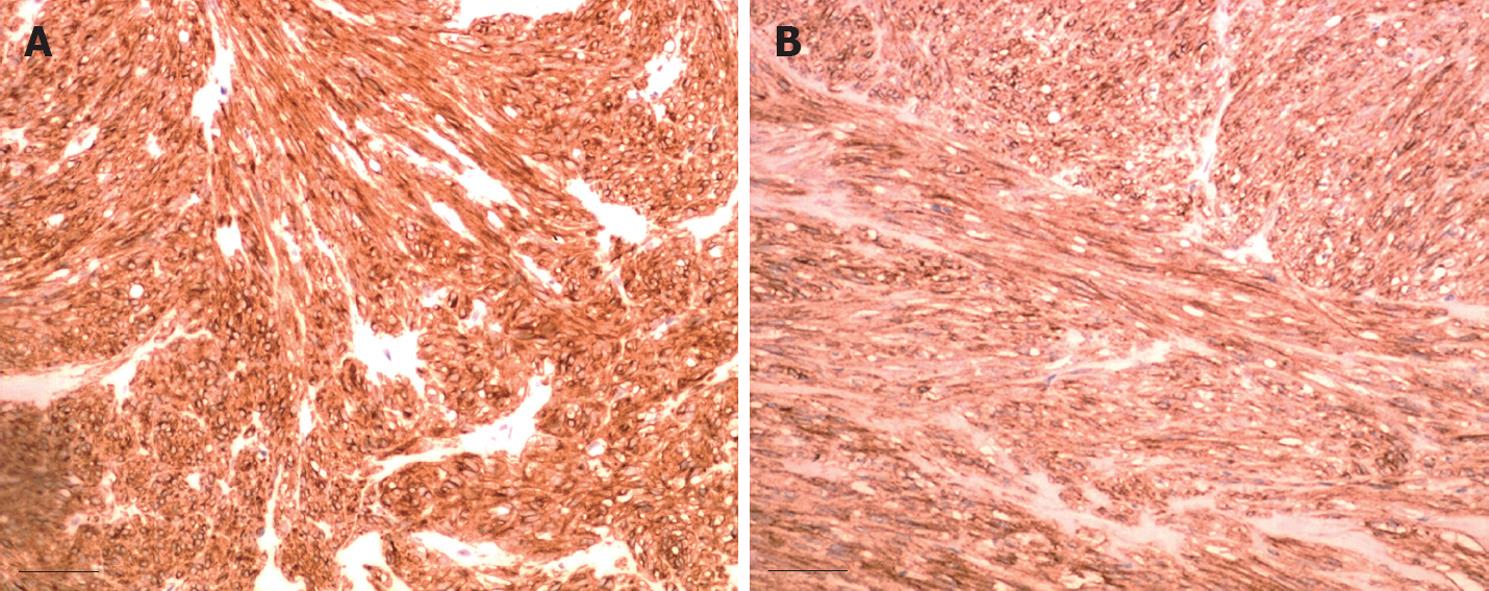
Figure 5 Over-expression of CD117 (A) and CD34 (B) (200 ×).
Scale bar = 100 μm.
- Citation: Mou YP, Xu XW, Xie K, Zhou W, Zhou YC, Chen K. Laparoscopic wedge resection of synchronous gastric intraepithelial neoplasia and stromal tumor: A case report. World J Gastroenterol 2010; 16(39): 5005-5008
- URL: https://www.wjgnet.com/1007-9327/full/v16/i39/5005.htm
- DOI: https://dx.doi.org/10.3748/wjg.v16.i39.5005


