Copyright
©2010 Baishideng.
World J Gastroenterol. Apr 28, 2010; 16(16): 2046-2054
Published online Apr 28, 2010. doi: 10.3748/wjg.v16.i16.2046
Published online Apr 28, 2010. doi: 10.3748/wjg.v16.i16.2046
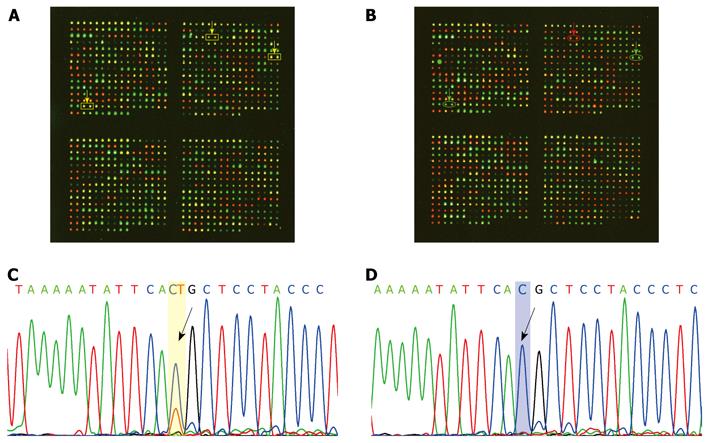
Figure 1 Representative case showing loss of heterozygosity.
A: Informative normal adjacent tissue in SNP array. Yellow arrow shows the SNP loci with heterozygous genotype; B: Corresponding tumor tissue in SNP array. Red (or green) arrow shows the corresponding SNP loci with homozygous genotype; C: Informative normal adjacent tissue in DNA sequencing. Arrow shows the SNP loci with heterozygous genotype; D: Corresponding tumor tissue in DNA sequencing. Arrow shows the corresponding SNP loci with homozygous genotype.
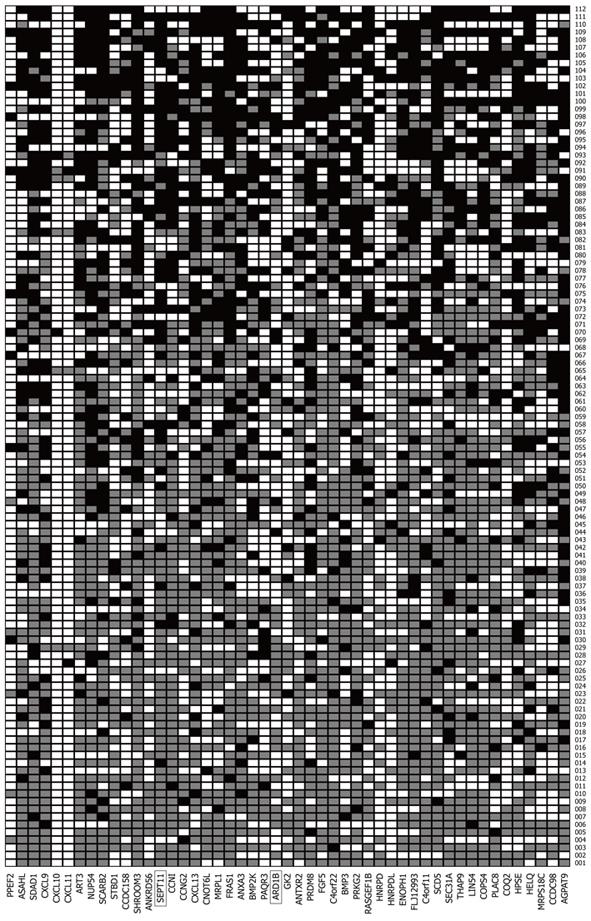
Figure 2 Summary of LOH analysis results.
Case numbers are indicated in the right column. Gene names are listed in the bottom row, in the order of physical position from 77 Mb to 84 Mb (left to right). Gray boxes: Retention; White boxes: Noninformative; Black boxes: LOH.
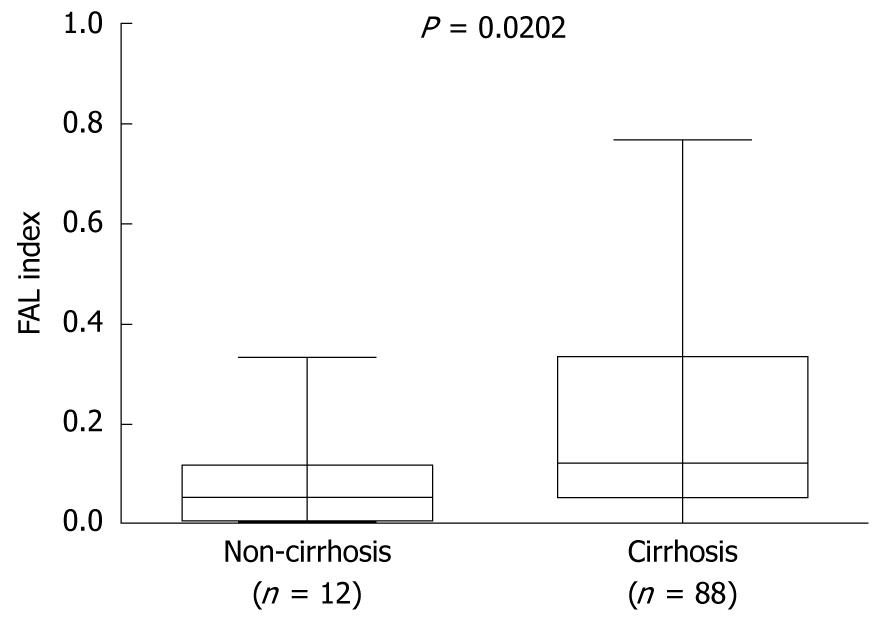
Figure 3 Correlation between FAL index (fractional allelic loss) and tumor size.
The box plot shows the median, quartile, and extreme values; the lines across the boxes indicate median FAL index.
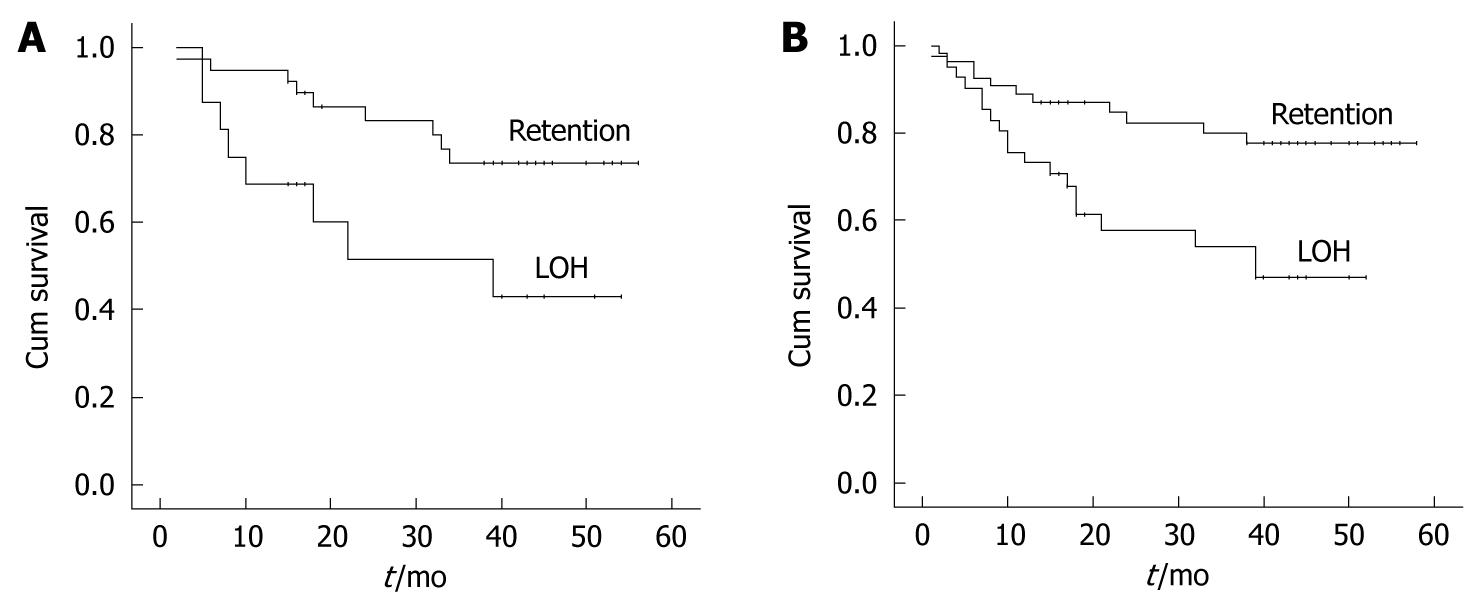
Figure 4 The association of loss of heterozygosity (LOH) in gene ARD1 homolog B (ARD1B) and septin 11 (SEPT11) with the postoperative survival of patients.
A: Kaplan-Meier overall survival plot based on LOH in ARD1B (log-rank test, P = 0.021); B: Kaplan-Meier overall survival plot based on LOH in SEPT11 (log-rank test, P = 0.004).
- Citation: Huang GL, Li BK, Zhang MY, Zhang HZ, Wei RR, Yuan YF, Shi M, Chen XQ, Huang L, Li AH, Huang BJ, Li HH, Wang HY. LOH analysis of genes around D4S2964 identifies ARD1B as a prognostic predictor of hepatocellular carcinoma. World J Gastroenterol 2010; 16(16): 2046-2054
- URL: https://www.wjgnet.com/1007-9327/full/v16/i16/2046.htm
- DOI: https://dx.doi.org/10.3748/wjg.v16.i16.2046


