Copyright
©2009 The WJG Press and Baishideng.
World J Gastroenterol. Nov 14, 2009; 15(42): 5340-5345
Published online Nov 14, 2009. doi: 10.3748/wjg.15.5340
Published online Nov 14, 2009. doi: 10.3748/wjg.15.5340
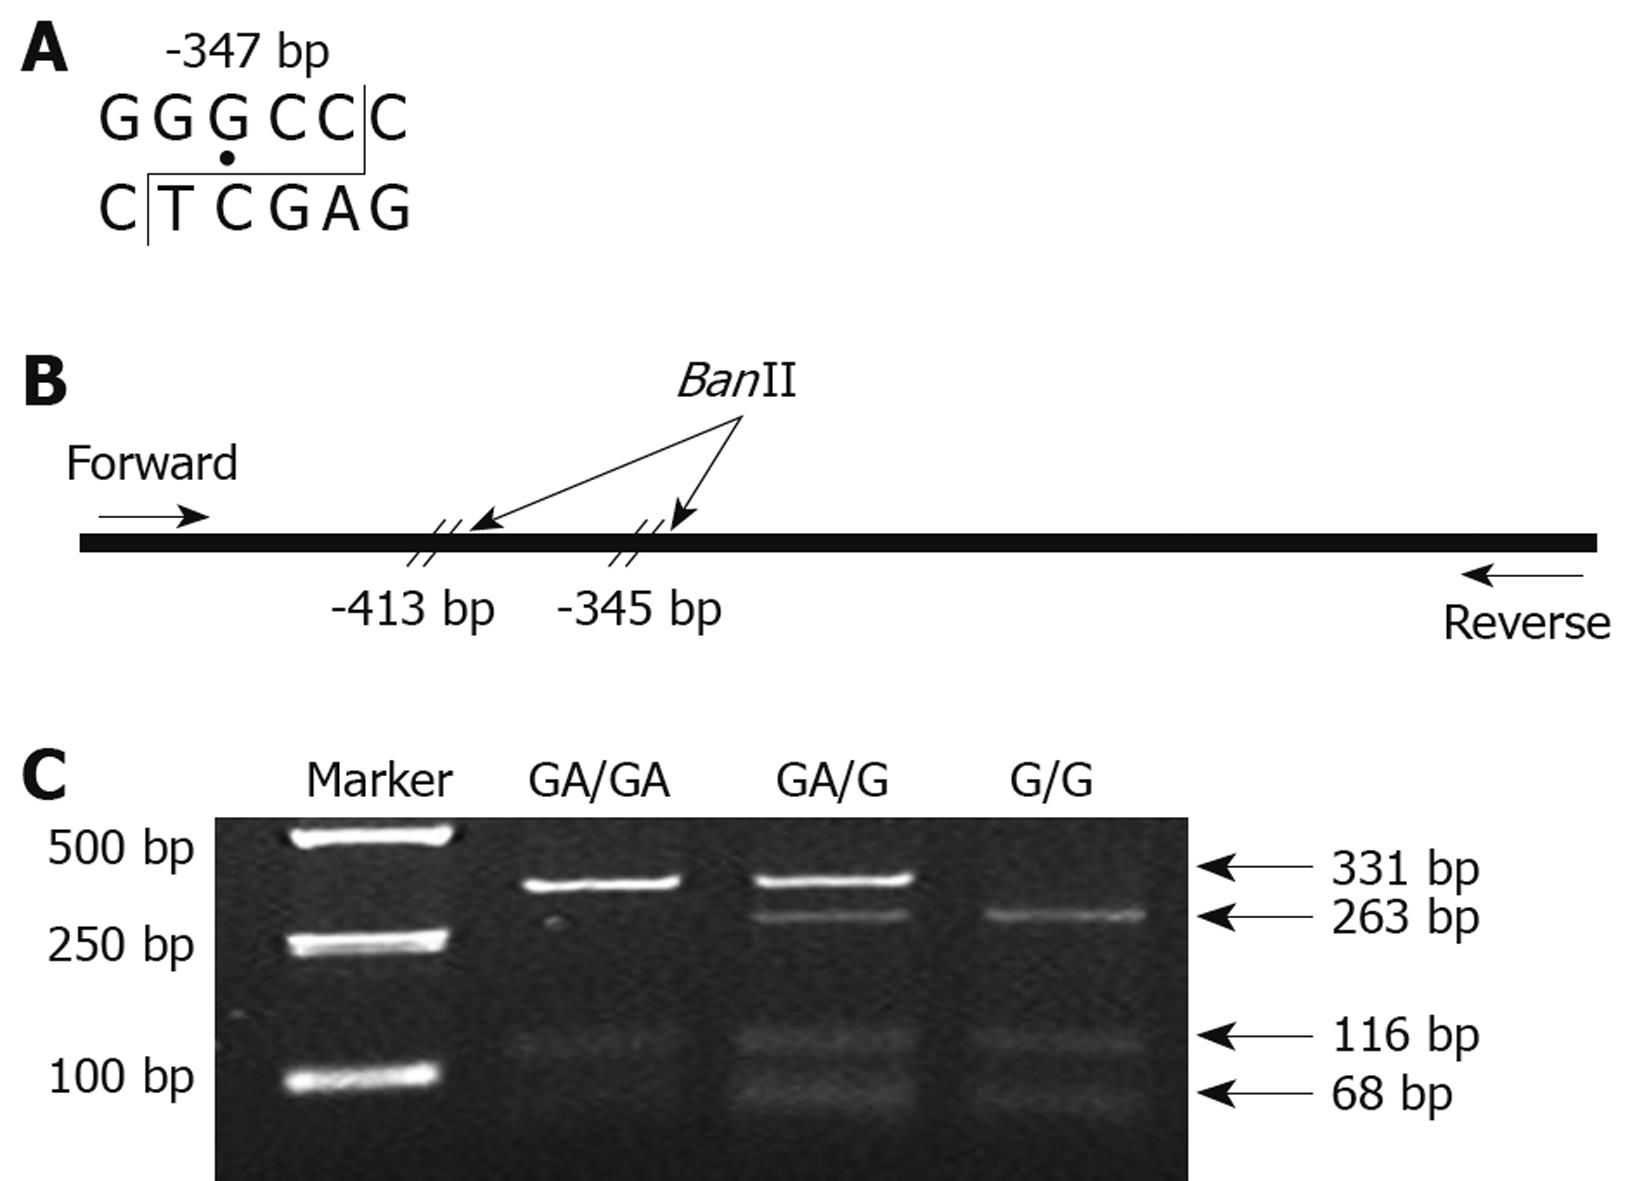
Figure 1 Genotyping analysis of the CDH1 -347G→GA polymorphism by PCR-RFLP analysis.
A: Structural diagram of the restriction enzyme analysis for BanII; B: Schematic overview of the E-cadherin gene promoter PCR fragment and the locations of the BanII restriction enzyme sites; C: RFLP analysis of the -347G→GA polymorphism using BanII digestion. GA/GA homozygote: 332 and 116 bp; GA/G heterozygote: 332, 263, 116 and 68 bp; G/G homozygote: 263, 116 and 68 bp.
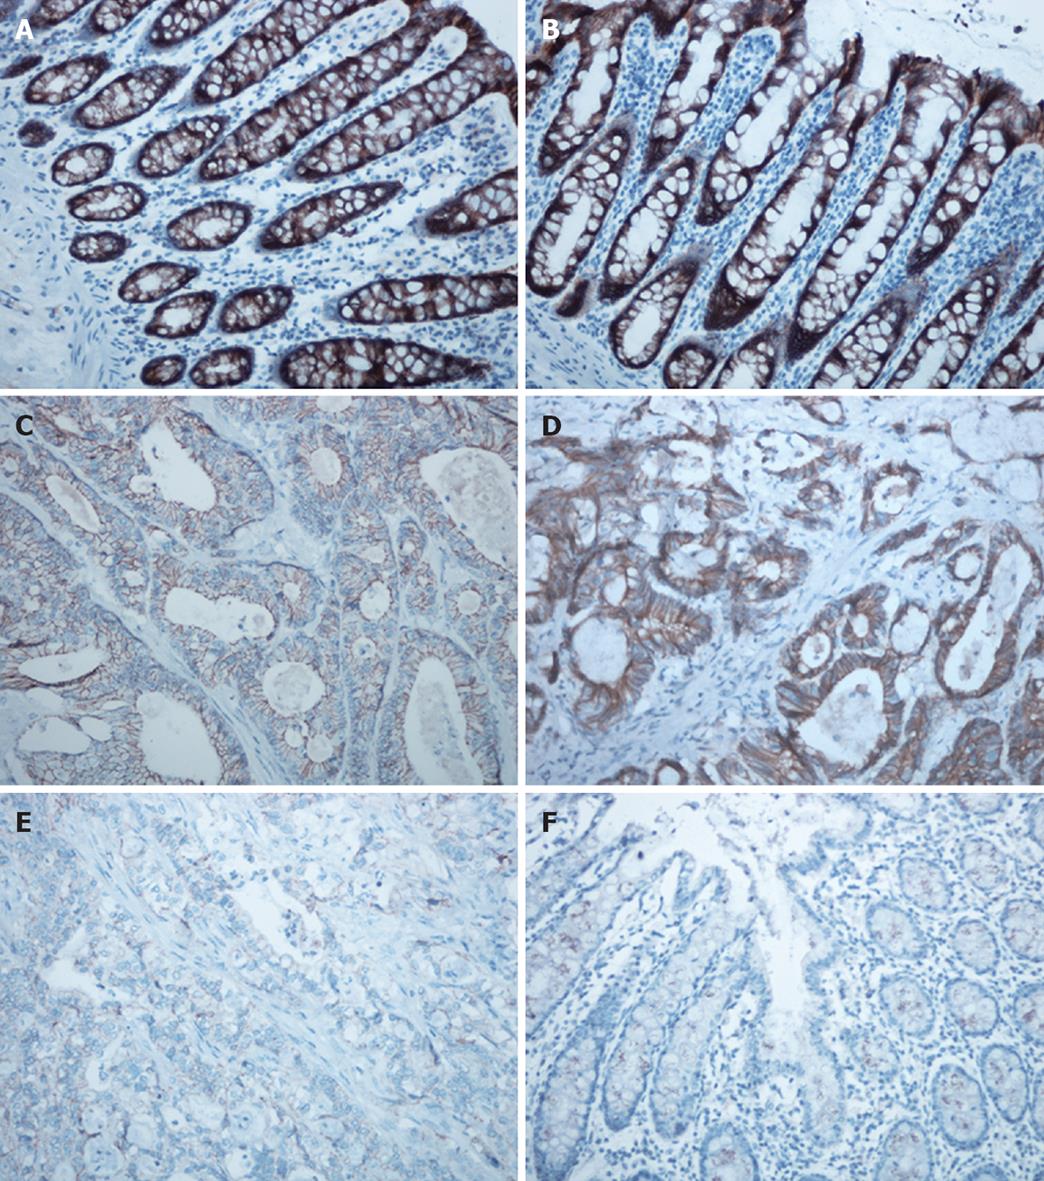
Figure 2 Immunohistochemical staining for E-cadherin.
A,B: E-cadherin expression in normal colorectal tissue with the G-allele (A) and GA-allele (B) (each, × 200); C,D: E-cadherin expression in well differentiated CRC with the GA-allele (C) and G-allele (D) (each, × 200); E: E-cadherin expression in poorly differentiated CRC with the GA-allele (× 200); F: Negative control (× 200).
Figure 3 E-cadherin expression in colon tissues of different types.
A: E-cadherin expression is significantly higher in normal controls than in CRC patients (t-test, P < 0.001); B: E-cadherin expression is significantly higher in well differentiated CRC patients than in poorly differentiated CRC patients (t-test, P = 0.001); C: There is no significant difference in E-cadherin expression between the G-allele and GA-allele in normal controls (t-test, P = 0.292). However, E-cadherin expression is significantly higher for the G-allele than for the GA-allele in CRC patients (t-test, P = 0.018).
-
Citation: Zou XP, Dai WJ, Cao J.
CDH1 promoter polymorphism (-347G→GA) is a possible prognostic factor in sporadic colorectal cancer. World J Gastroenterol 2009; 15(42): 5340-5345 - URL: https://www.wjgnet.com/1007-9327/full/v15/i42/5340.htm
- DOI: https://dx.doi.org/10.3748/wjg.15.5340


