Copyright
©2008 The WJG Press and Baishideng.
World J Gastroenterol. Dec 14, 2008; 14(46): 7127-7132
Published online Dec 14, 2008. doi: 10.3748/wjg.14.7127
Published online Dec 14, 2008. doi: 10.3748/wjg.14.7127
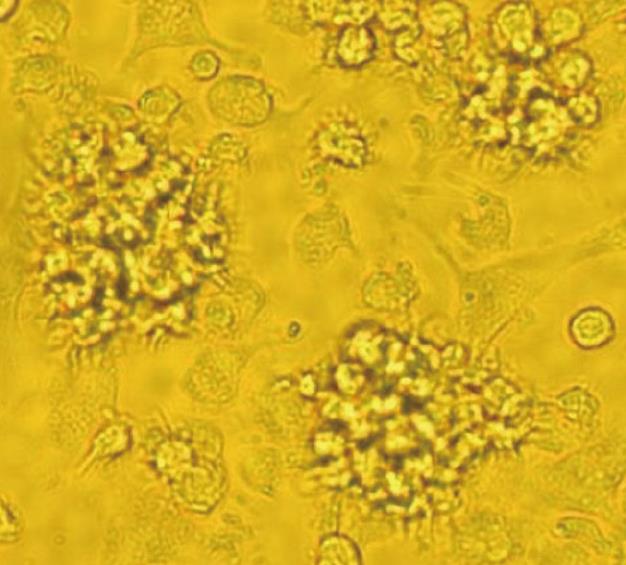
Figure 1 Morphological characteristic of BM-DCs.
c-kit+ hematopoietic progenitor cells from the BALB/c mice bone marrow cells were cultured in presence of GM-CSF, IL-4, or TNFα for 8 d, and then these cells were observed by light microscopy (× 200).
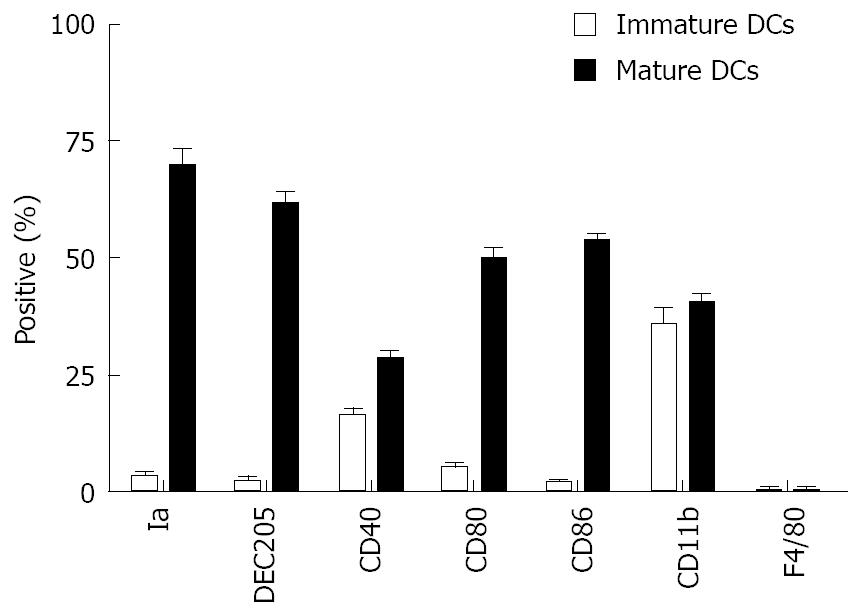
Figure 2 Immunophenotypic analysis of BM-DCs.
BM-DCs (2 × 10⁵-4 ×10⁵ cells) cultured for 5 d or 8 d were incubated with FITC- or PE-labeled MAbs. The phenotypes of these cells were analyzed by immunofluorescence staining as described in the Materials and Methods. The results are representative of three independent experiments and the data are given as mean ± SE.
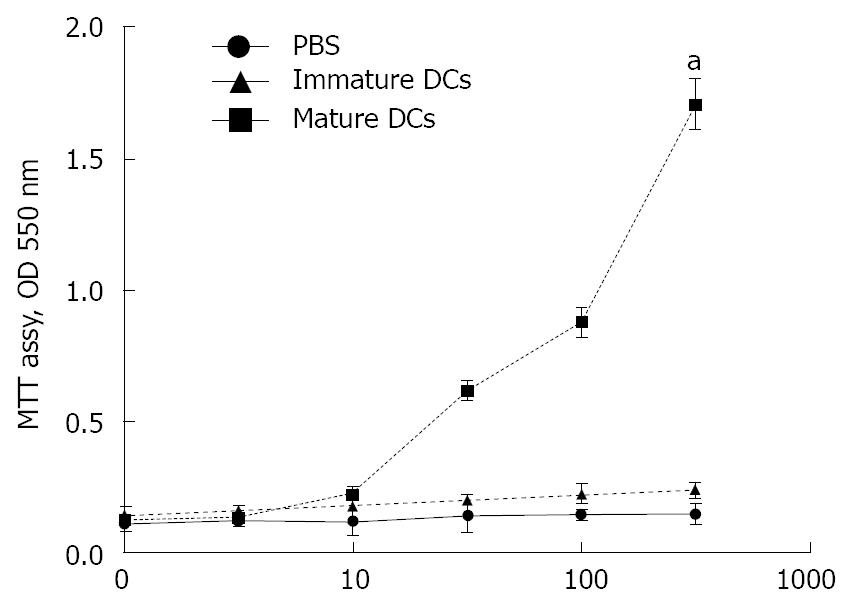
Figure 3 The capacity of BM-DCs to enhance allogeneic MLR.
Allogeneic mixed-leukocyte reactions were performed using splenic T cells purified from B6 mice as responder cells. Immature or mature DCs were treated with MMC to arrest cell proliferation and were used as stimulator cells at the indicated cell numbers. PBS was used as a control. T-cell proliferation was determined by using an MTT assay after 5 d of culture. The results are representative of three independent experiments and the data are given as mean ± SE. aP < 0.05, mature DCs group versus immature DCs group or PBS group.
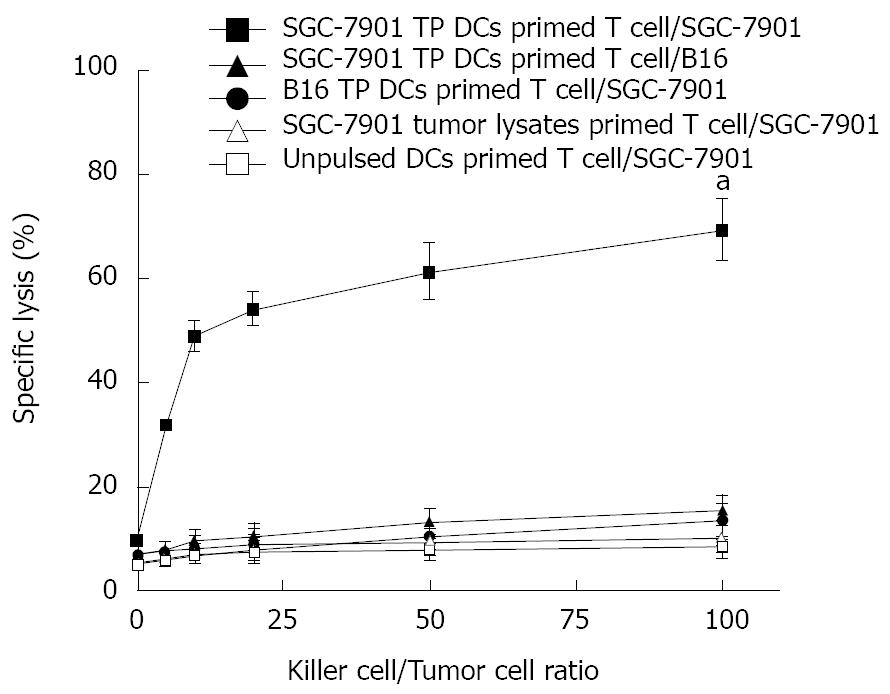
Figure 4 Generation of tumor-specific cytotoxic T cells ex vivo.
Splenic CD3+ T cells were isolated from naïve B6 mice with MACS. T cells were primed with SGC-7901 tumor cell lysate-pulsed BM-derived DCs as described in Materials and Methods. Unpulsed DCs and SGC-7901 tumor lyastes were used as controls. The primed T cells (effector cells) were titrated by serial dilution (1:1, 5:1, 10:1, 25:1, 50:1, 100:1), and mixied with SGC-7901 or B16 target cells, and their lytic activity against SGC-7901 or B16 was assayed by a Cytotoxicity Detection Kit. Statistical analysis used the paired Student’s t test. The results are representative of three independent experiments. Data are given as mean ± SE. aP < 0.05, SGC-7901 TP DCs primed T cell/SGC-7901 group versus SGC-7901 TP DCs primed T cell/B16 group or other control groups.
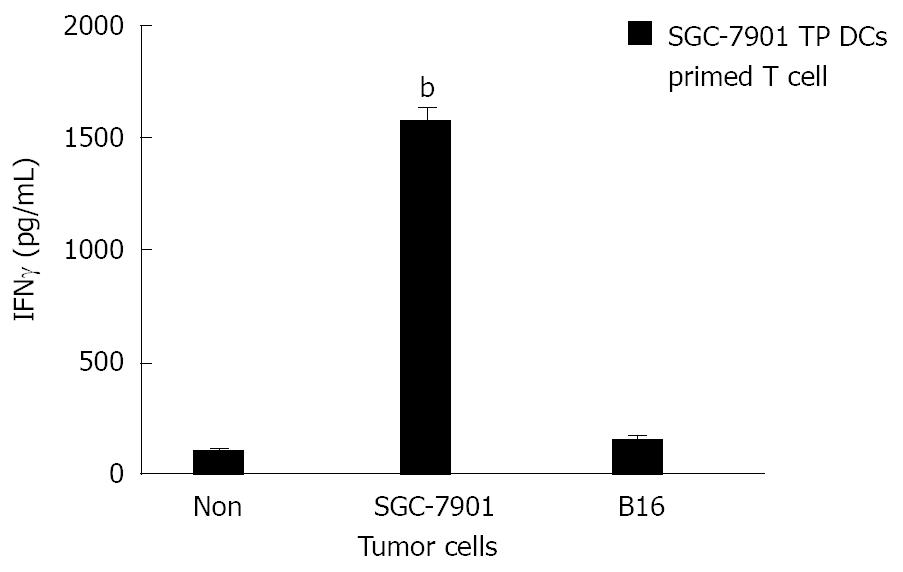
Figure 5 Assays for IFNγ secretion ex vivo.
Splenic CD3+ T cells were isolated from naïve BALB/c mice with MACS. T cells were primed with SGC-7901 tumor cell lysate-pulsed BM-derived DCs as described in Materials and Methods. The primed T cells (effector cells) were mixied and incubated with SGC-7901 or B16 target cells. Supernatant from each well was collected for measuring IFNγ production with the mouse IFNγ ELISA kit. Statistical analysis used the paired Student’s t test. The results are representative of three independent experiments. Data are given as mean ± SE. bP < 0.01, SGC-7901 versus B16 or Non.
-
Citation: Li YL, Wu YG, Wang YQ, Li Z, Wang RC, Wang L, Zhang YY. Bone marrow-derived dendritic cells pulsed with tumor lysates induce anti-tumor immunity against gastric cancer
ex vivo . World J Gastroenterol 2008; 14(46): 7127-7132 - URL: https://www.wjgnet.com/1007-9327/full/v14/i46/7127.htm
- DOI: https://dx.doi.org/10.3748/wjg.14.7127


