Copyright
©2008 The WJG Press and Baishideng.
World J Gastroenterol. May 7, 2008; 14(17): 2702-2714
Published online May 7, 2008. doi: 10.3748/wjg.14.2702
Published online May 7, 2008. doi: 10.3748/wjg.14.2702
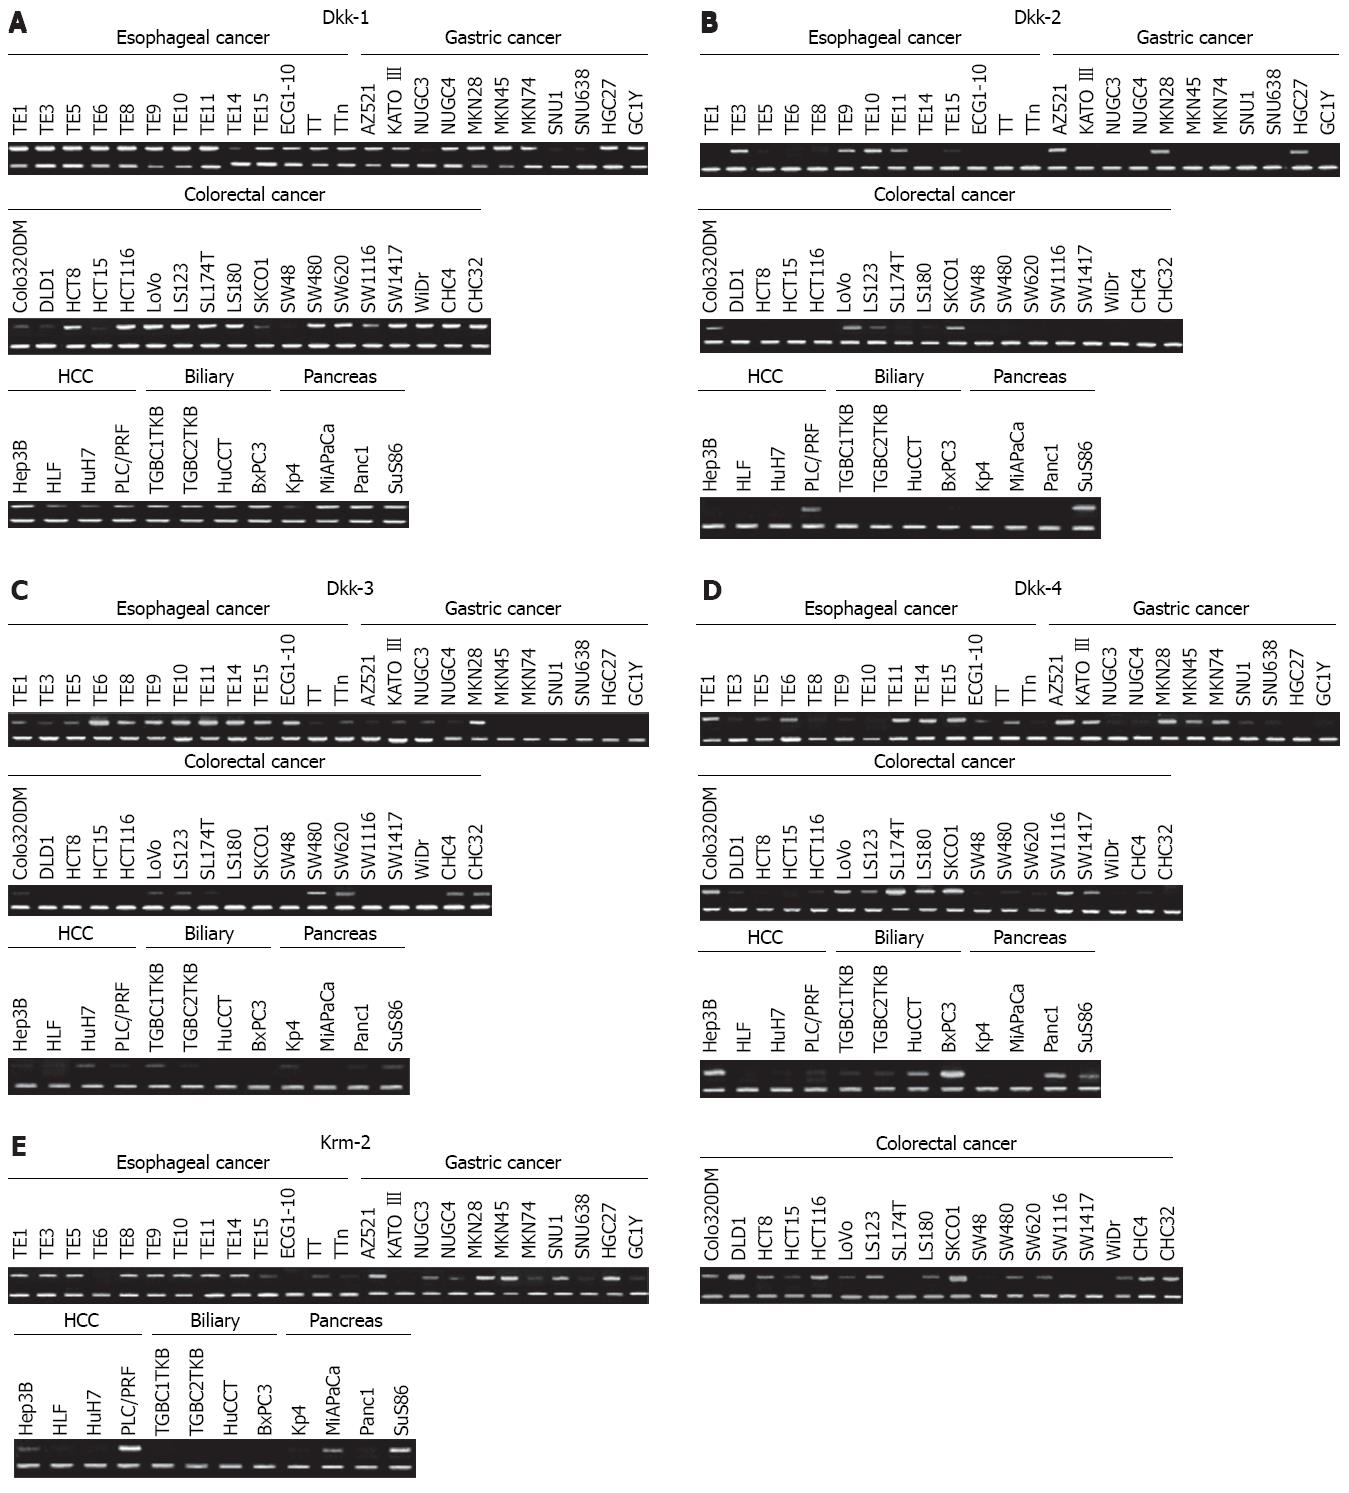
Figure 1 RT-PCR analysis of the Dkks and Krm2 genes in gastrointestinal cancer cell lines.
RT-PCR was performed using cDNA from 13 esophageal, 11 gastric, 16 colorectal, 6 hepatocellular, 3 biliary tract and 5 pancreas cancer cell lines.
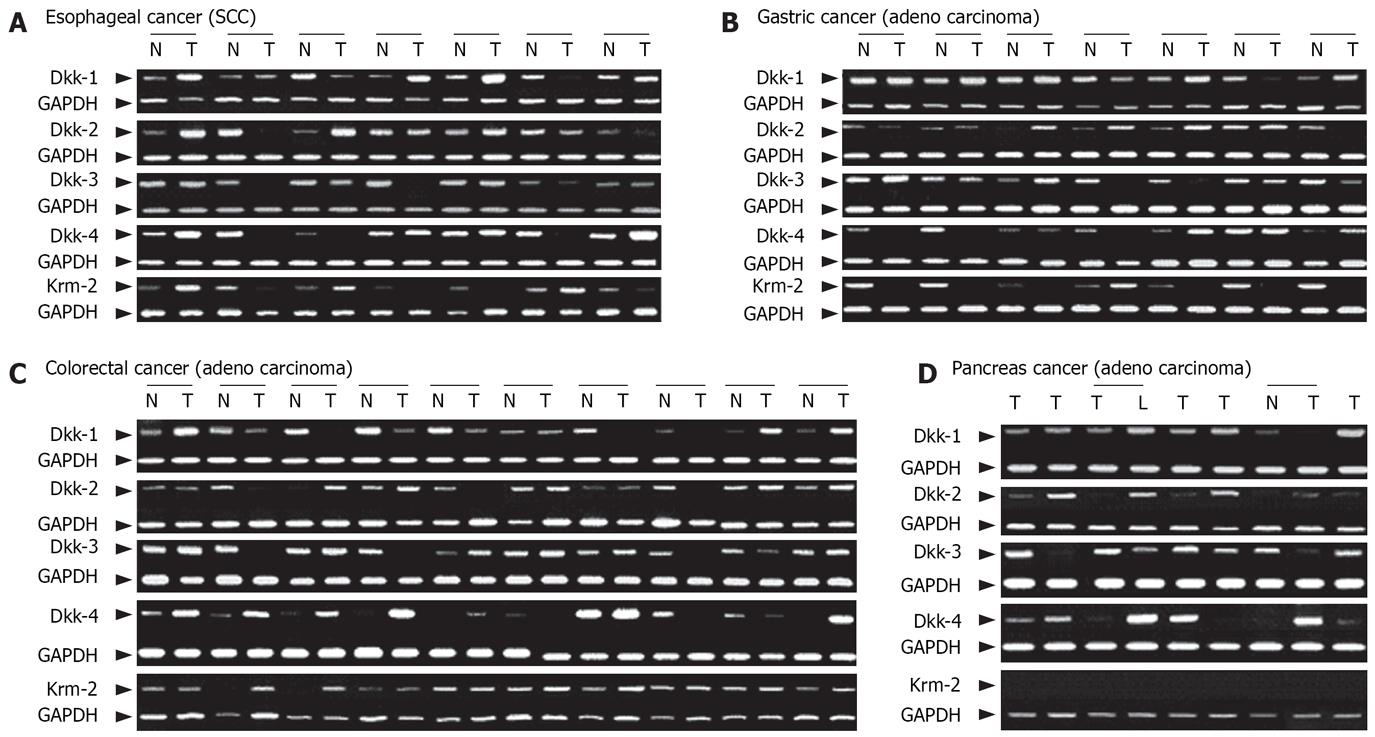
Figure 2 RT-PCR analysis of the Dkks and Krm2 genes in gastrointestinal cancer tissues.
Expression of GAPDH was examined to monitor cDNA integrity. N and T are matched samples from non-tumor and tumor tissue, respectively.
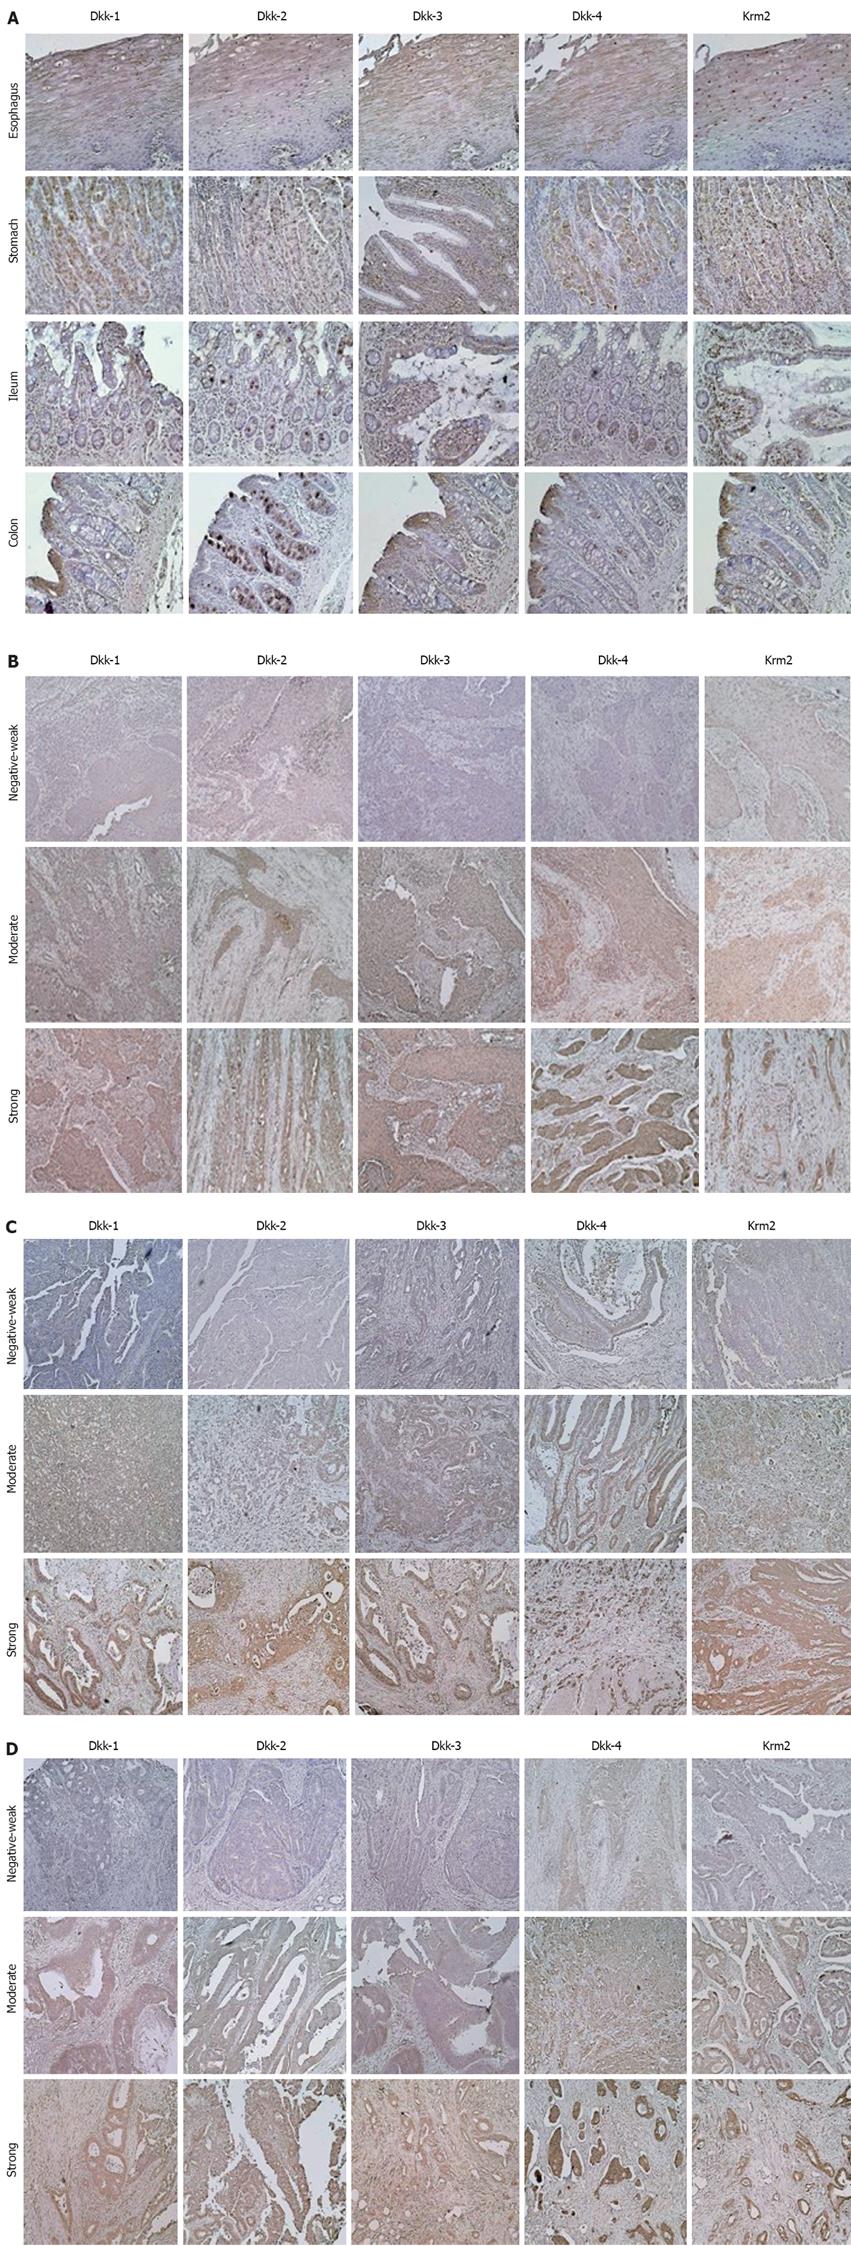
Figure 3 Immunohistochemical expression of Dkks in gastrointestinal normal and cancer tissues.
A: Normal tissues; B: Esophageal cancer tissues; C: Gastric cancer tissues; D: Colorectal cancer tissues (× 200).
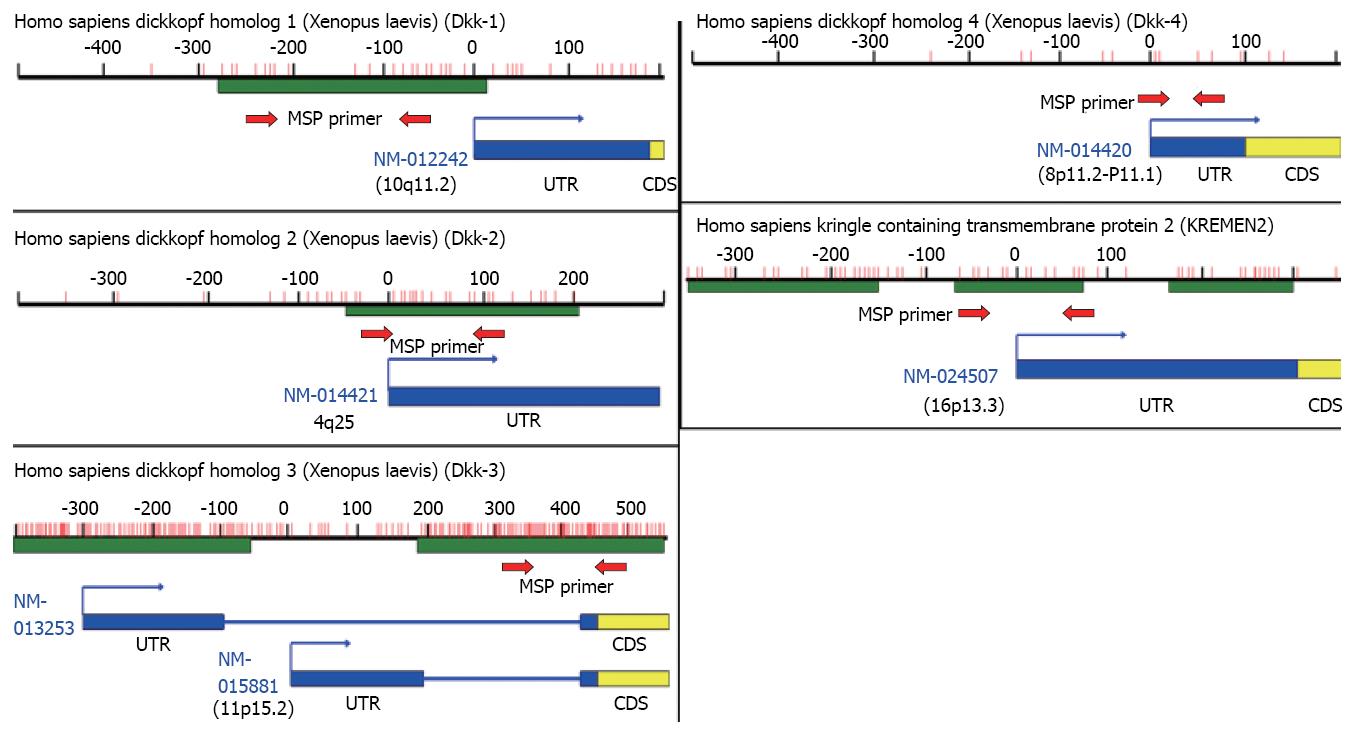
Figure 4 Scheme of the promoter regions of the Dkk genes and Krm2 gene.
The 5' regions of the genes were identified by a BLAST search. We used a CpG island searcher that screens for CpG islands that meet the following criteria: CG percentage > 55% observed CpG/expected CpG > 0.65 length > 500 bp. CpG sites are represented by vertical bars. The arrows below CpG islands represent regions analyzed by MSP. The Dkk-1, Dkk-2, Dkk-3, and Krm2 genes contain CpG islands at their 5’ ends and Dkk-4 has a few CpGs in the promoter region.
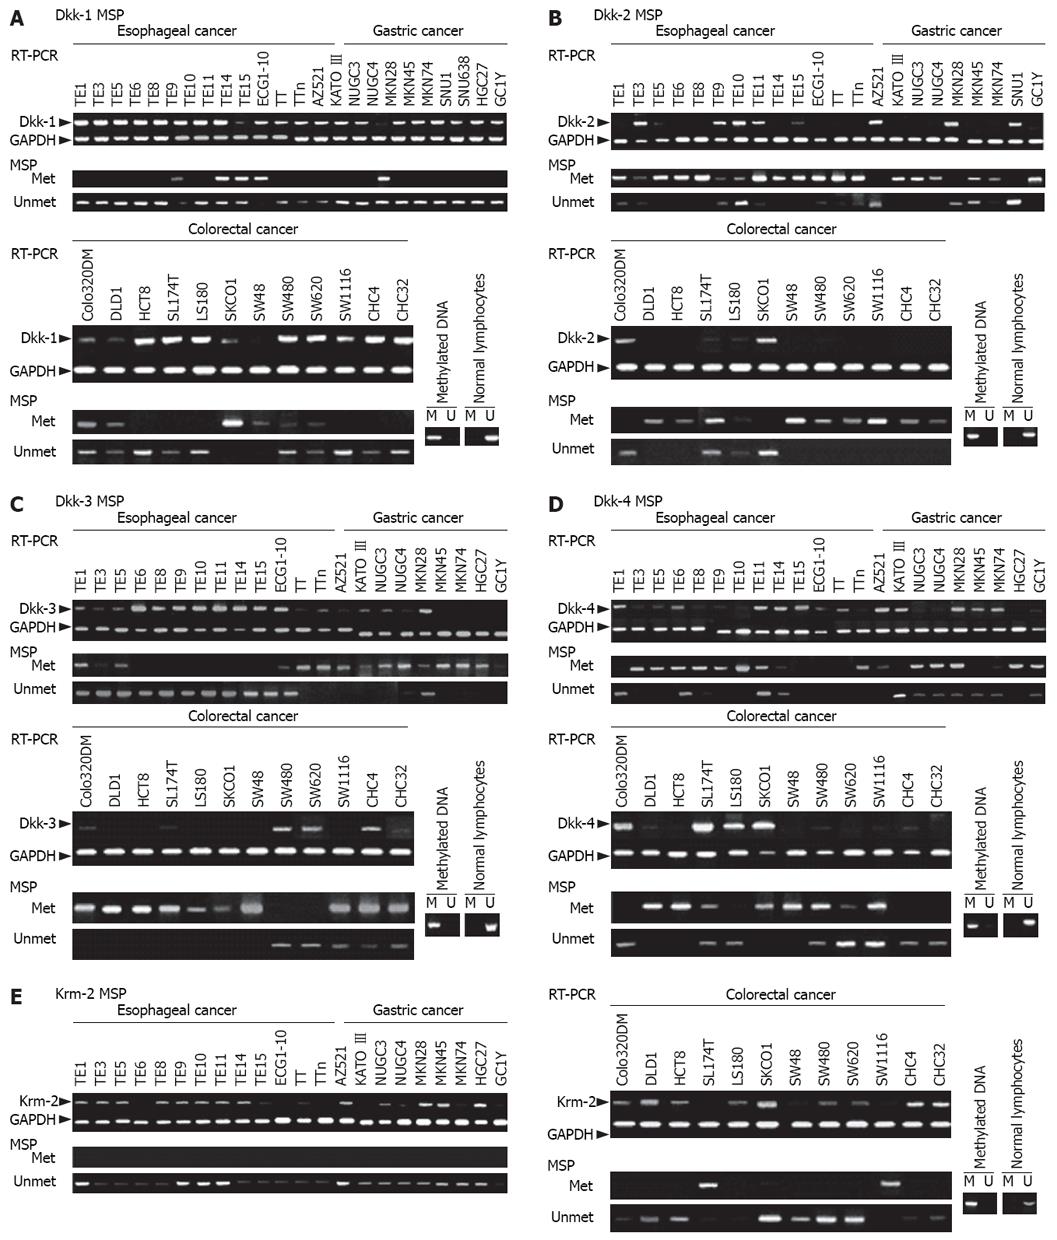
Figure 5 Correlation of methylation in the promoter region with silencing of the Dkk genes in gastrointestinal cancer cell lines.
RT-PCR and MSP were carried out using cDNA and genomic DNA from the indicated cancer cell lines, respectively. In vitro methylated DNA (CpG Genome Universal Methylated DNA from Chemicon International, Temecula, CA) was used as a positive control for methylated alleles, while DNA from normal lymphocytes was used as negative controls.
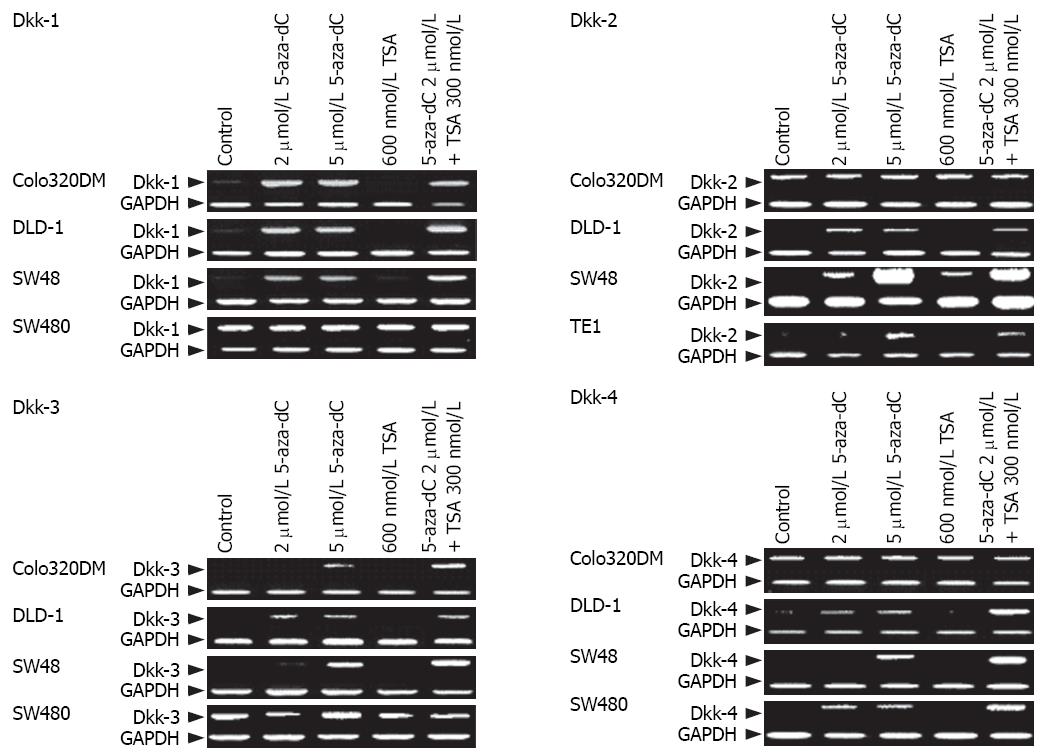
Figure 6 Reactivation of Dkks expression by 5-aza-dC treatment in gastrointestinal cancer cell lines.
Cells were treated indicated.
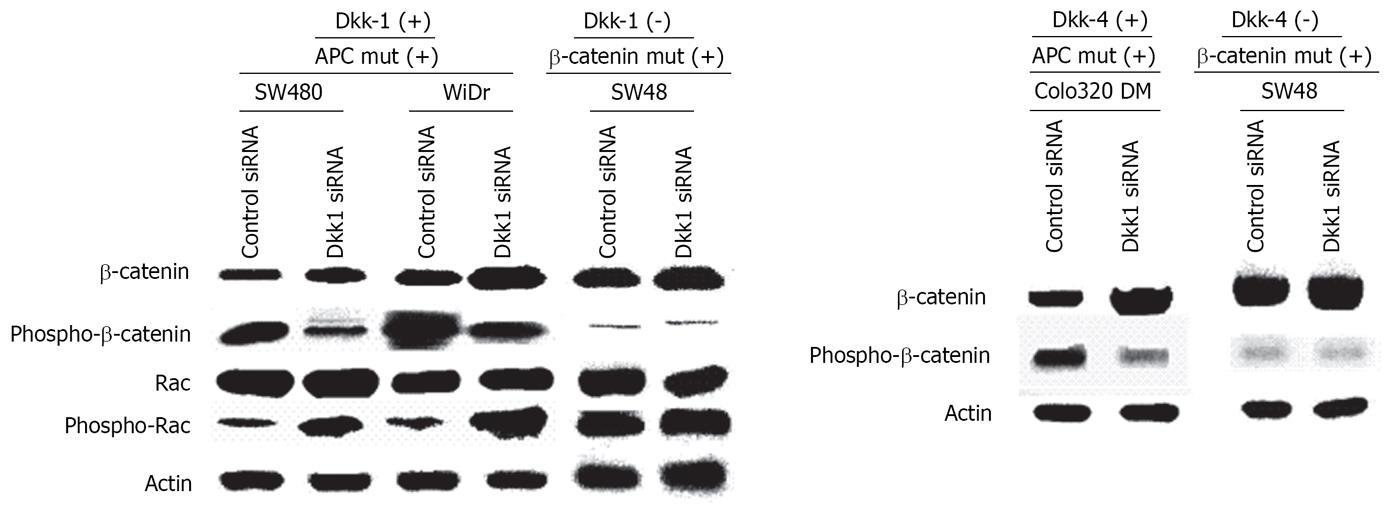
Figure 7 Western blot analysis in cancer cells treated with Dkk-specific siRNA.
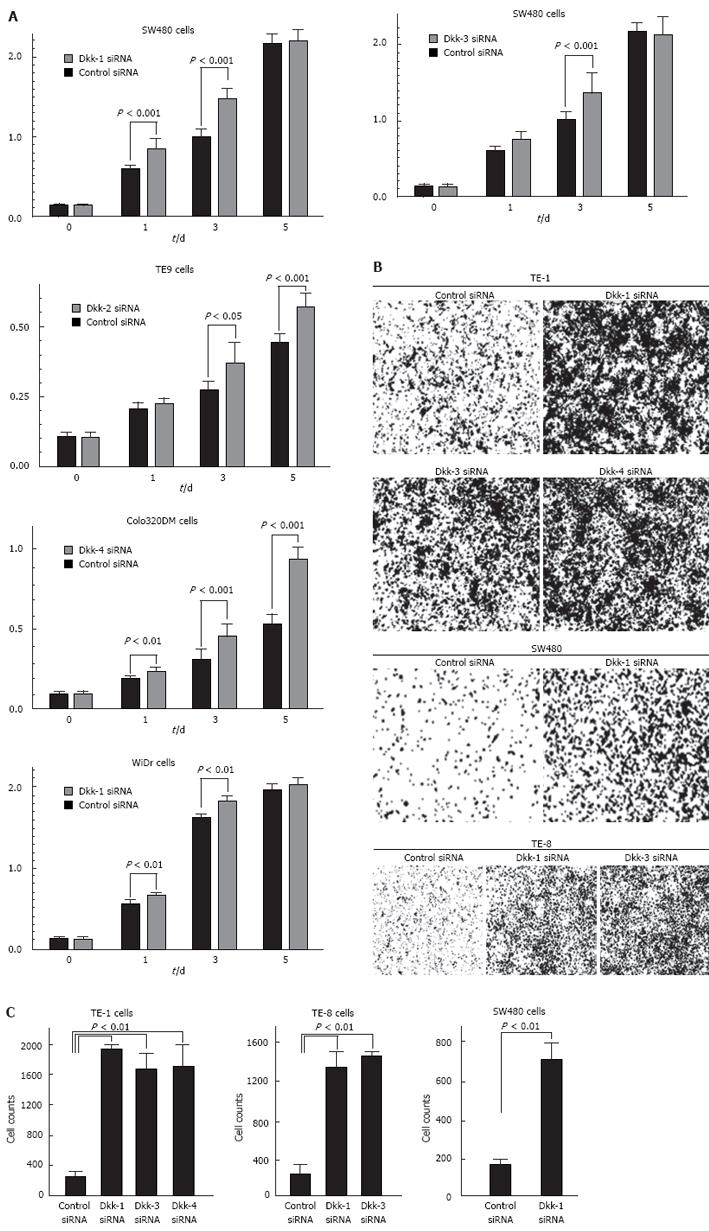
Figure 8 Enhancement of cancer cell growth and invasiveness by Dkk siRNA treatment.
A: WST-8 assays after treatment with specific siRNA for the Dkk genes were performed to assess the role of the expression of Dkks in cancer cell proliferation; B and C: In vitro invasion assays after treatment with specific siRNA for the Dkk genes were performed to assess the role of the expression of Dkks in cancer cell invasiveness.
- Citation: Maehata T, Taniguchi H, Yamamoto H, Nosho K, Adachi Y, Miyamoto N, Miyamoto C, Akutsu N, Yamaoka S, Itoh F. Transcriptional silencing of Dickkopf gene family by CpG island hypermethylation in human gastrointestinal cancer. World J Gastroenterol 2008; 14(17): 2702-2714
- URL: https://www.wjgnet.com/1007-9327/full/v14/i17/2702.htm
- DOI: https://dx.doi.org/10.3748/wjg.14.2702


