Copyright
©2008 The WJG Press and Baishideng.
World J Gastroenterol. Apr 14, 2008; 14(14): 2162-2167
Published online Apr 14, 2008. doi: 10.3748/wjg.14.2162
Published online Apr 14, 2008. doi: 10.3748/wjg.14.2162
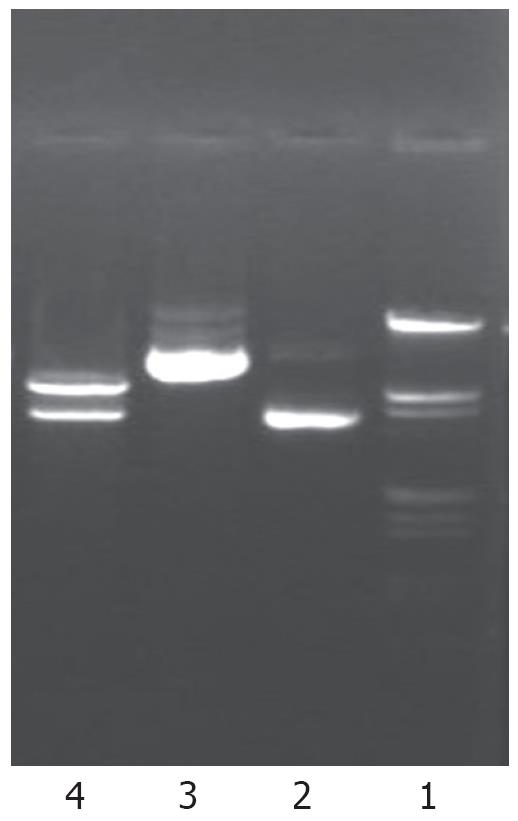
Figure 1 Identification of antisense human NHE1 cDNA vector digested by restriction endonuclease.
Lane 1: Marker (λDNA/EcoRI+ HindIII); Lane 2: pcDNA3.1 (-)/Zeo plasmid; Lane 3: pcDNA3.1-NHE1 plasmid; Lane 4: pcDNA3.1-NHE1 plasmid digested by EcoRI and HindIII (5.0 and 3.6 kb).
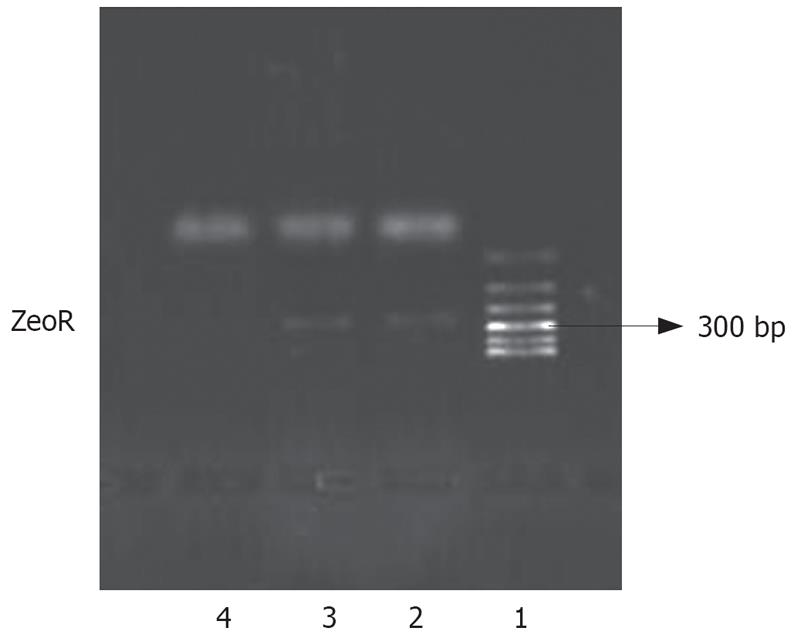
Figure 2 Analysis of exogenous gene integration in nucleic DNA of SGC-7901.
Lane 1: Polymerase chain reaction marker; Lane 2: 7901-zeo; Lane 3: 7901-AS; Lane 4: SGC-7901.
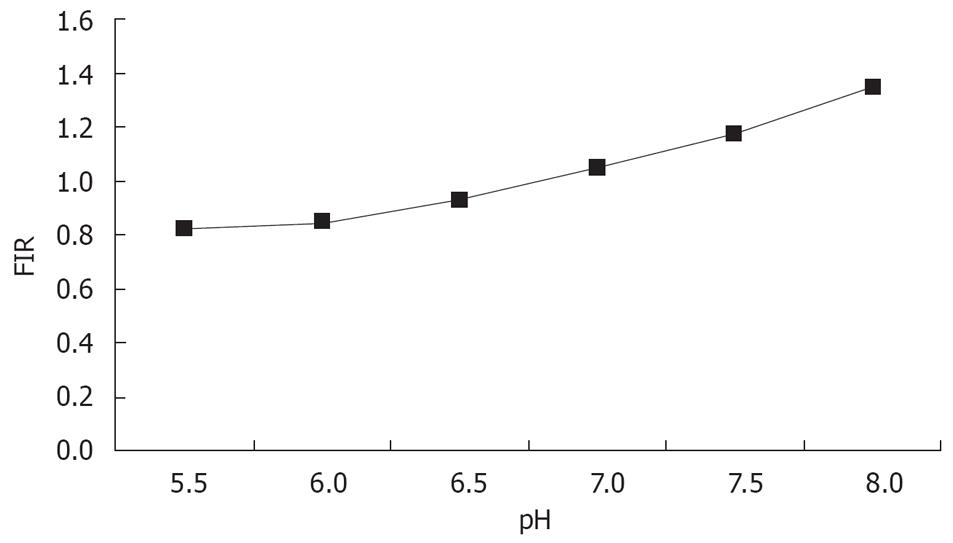
Figure 3 Standard curve of intracellular pH.
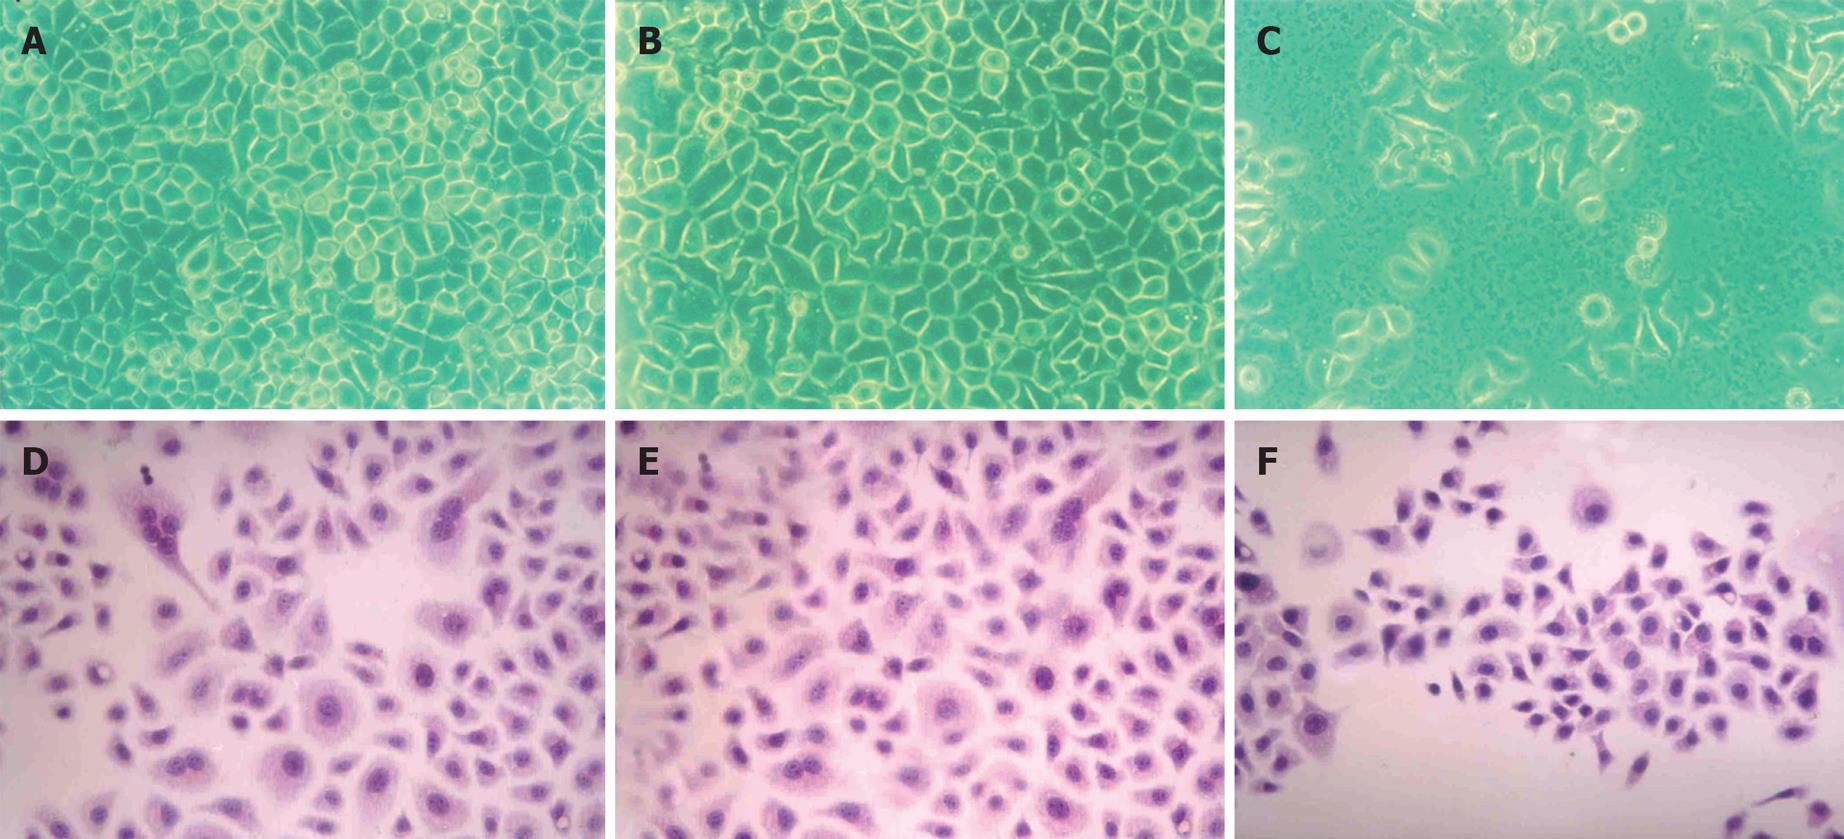
Figure 4 Morphorlogical changes in the transfected cells and parental cells.
The first row was observed under inverted microscope. The second row was stained with hematoxylin and eosin, and examined by light microscopy. (A) and (D) SGC-7901; (B) and (E) 7901-zeo; (C) and (F) 7901-AS.
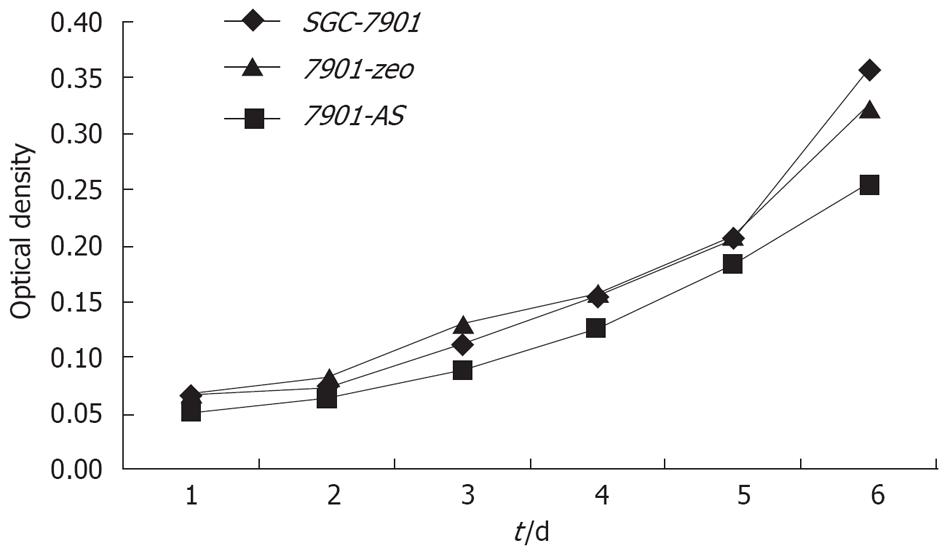
Figure 5 Comparison of growth curves of transfected cells and parental cells.
-
Citation: Liu HF, Teng XC, Zheng JC, Chen G, Wang XW. Effect of
NHE1 antisense gene transfection on the biological behavior ofSGC-7901 human gastric carcinoma cells. World J Gastroenterol 2008; 14(14): 2162-2167 - URL: https://www.wjgnet.com/1007-9327/full/v14/i14/2162.htm
- DOI: https://dx.doi.org/10.3748/wjg.14.2162


