Copyright
©2008 The WJG Press and Baishideng.
World J Gastroenterol. Mar 14, 2008; 14(10): 1570-1574
Published online Mar 14, 2008. doi: 10.3748/wjg.14.1570
Published online Mar 14, 2008. doi: 10.3748/wjg.14.1570
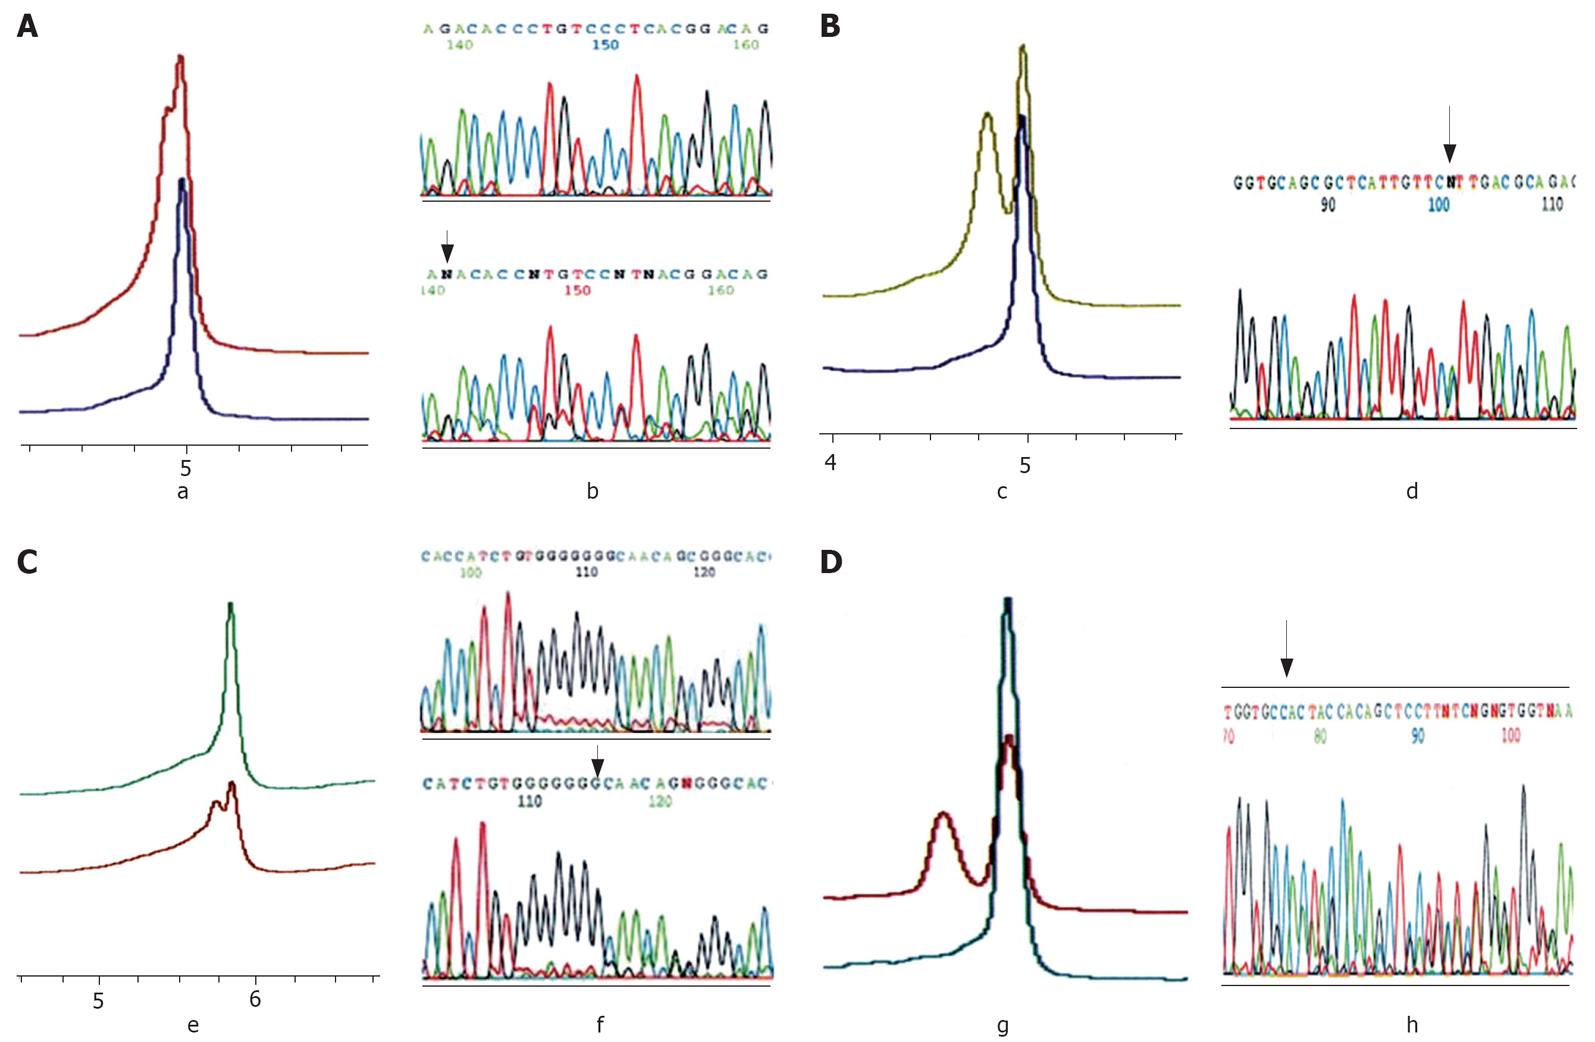
Figure 1 Typical elution profiles of DHPLC analysis and sequencing.
A: AXIN1 (exon2) mutation. a, DHPLC elution profiles. b, Sequence traces. The upper panel is a normal control; the lower panel is a frameshift mutation (del 1 bp). The arrow points to the mutant nucleotide; B: AXIN1 polymorphism. c, Representative DHPLC profiles of heteroduplex for AXIN1. The lower panel is a normal control; the upper panel is a heteroduplex. d, Sequence traces. The arrow points to the mutant nucleotide; C: AXIN2 (exon7) mutation. e, DHPLC elution profiles. f, Sequence traces. The upper panel is a normal control; the lower panel is a frameshift mutation (del 1 bp). The arrow points to the mutant nucleotide; D: CTNNB1 (exon3) mutation. g, DHPLC elution profiles. The lower panel is a normal control; the upper panel is a frameshift mutation (del 27 bp spanning exon3). h, Sequence traces for the frameshift mutation. The arrow points to the mutant nucleotide.
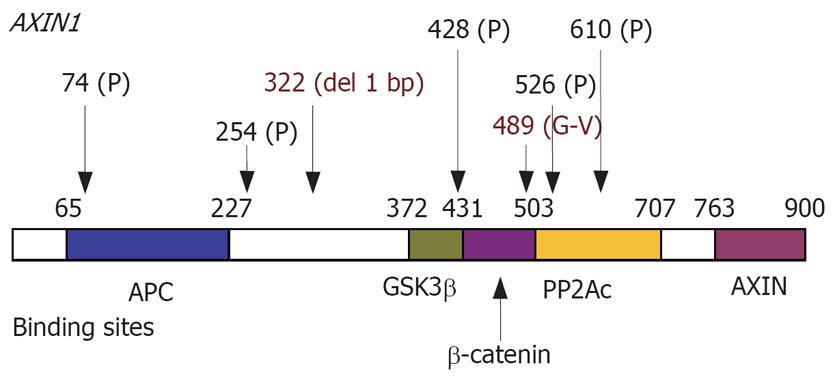
Figure 2 Mutations and polymorphisms found in AXIN1.
Bold lines indicate the coding regions corresponding to each protein-binding site. GSK3β: Glycogen synthase kinase 3β; PP2Ac: Protein phosphatase 2Ac; P: Polymorphism.
- Citation: Pan KF, Liu WG, Zhang L, You WC, Lu YY. Mutations in components of the Wnt signaling pathway in gastric cancer. World J Gastroenterol 2008; 14(10): 1570-1574
- URL: https://www.wjgnet.com/1007-9327/full/v14/i10/1570.htm
- DOI: https://dx.doi.org/10.3748/wjg.14.1570


