Copyright
©2007 Baishideng Publishing Group Co.
World J Gastroenterol. Mar 7, 2007; 13(9): 1360-1364
Published online Mar 7, 2007. doi: 10.3748/wjg.v13.i9.1360
Published online Mar 7, 2007. doi: 10.3748/wjg.v13.i9.1360
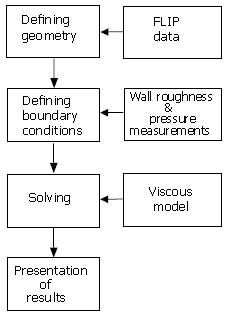
Figure 1 Flow diagram of CFD process.
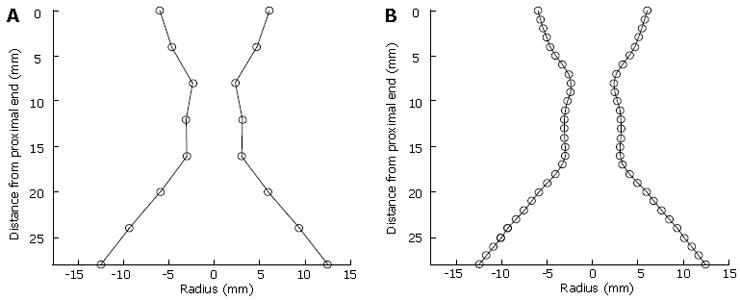
Figure 2 A: OGJ geometry as extracted from FLIP.
B:Interpolated OGJ geometry.
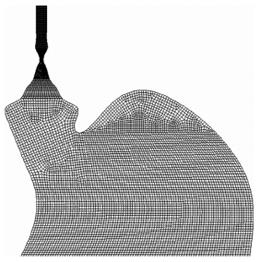
Figure 3 Example of a CFD mesh.
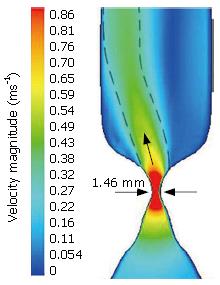
Figure 4 Velocity Magnitude (m/s) through the OGJ and into the oesophagus (limited to 0.
9 m/s).
Math 1 Math(A1).
- Citation: McMahon BP, Odie KD, Moloney KW, Gregersen H. Computation of flow through the oesophagogastric junction. World J Gastroenterol 2007; 13(9): 1360-1364
- URL: https://www.wjgnet.com/1007-9327/full/v13/i9/1360.htm
- DOI: https://dx.doi.org/10.3748/wjg.v13.i9.1360


