Copyright
©2007 Baishideng Publishing Group Co.
World J Gastroenterol. Jul 21, 2007; 13(27): 3684-3691
Published online Jul 21, 2007. doi: 10.3748/wjg.v13.i27.3684
Published online Jul 21, 2007. doi: 10.3748/wjg.v13.i27.3684
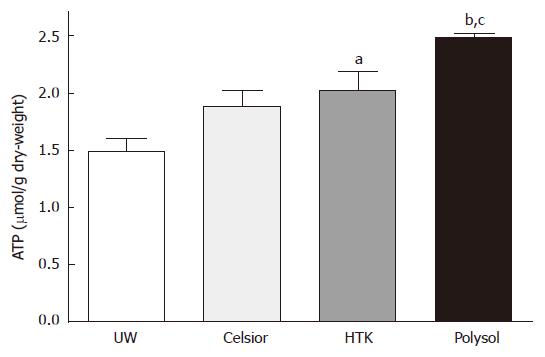
Figure 1 Tissue ATP Content as a parameter for functional recovery of the mitochondria and resultant tissue integrity after 18 h cold storage and 30 min oxygenated reperfusion.
Data are expressed as micromoles per gram of tissue dry-weight (mean ± SE, n = 6 each). aP < 0.05 vs UW, bP < 0.001 vs UW, cP < 0.05 vs Celsior.
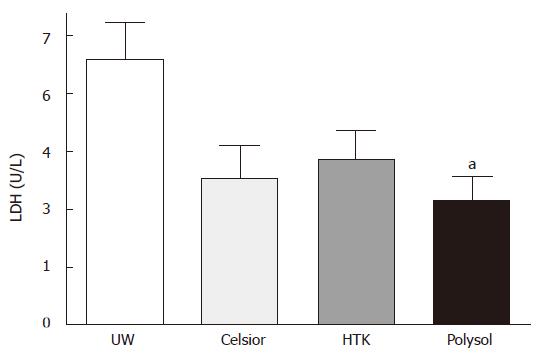
Figure 2 LDH release into the perfusate, as a parameter for general tissue damage after 18 h cold storage and 30 min oxygenated reperfusion (mean ± SE, n = 7 each).
aP < 0.05 vs UW.
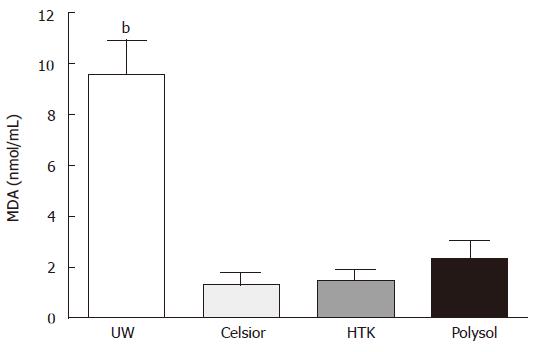
Figure 3 MDA concentrations in the graft tissues, as an index for lipid peroxidation after 18 h cold storage and 30 min oxygenated reperfusion (mean ± SE, n = 6 each).
bP < 0.001 vs Celsior, HTK and Polysol.
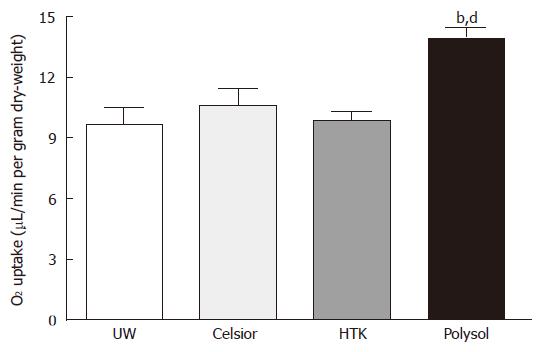
Figure 4 Tissue oxygen consumption at 30 min oxygenated reperfusion, as a parameter for the remaining metabolic activity of the grafts (mean ± SE, n = 7 each).
bP < 0.01 vs HTK and Celsior, dP < 0.001 vs UW.
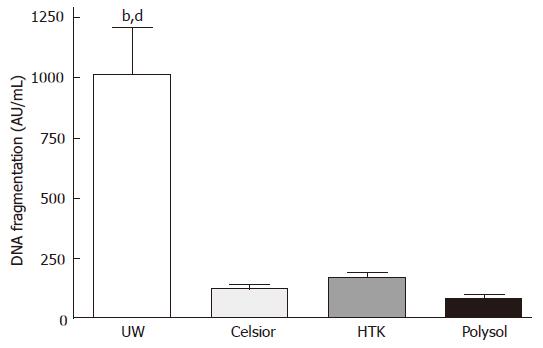
Figure 5 The release of fragmented DNA into the perfusate at 15 min of reperfusion using a Cell Death Detection ELISA kit (mean ± SE, n = 6 each).
bP < 0.01 vs HTK, dP < 0.001 vs Celsior and Polysol.
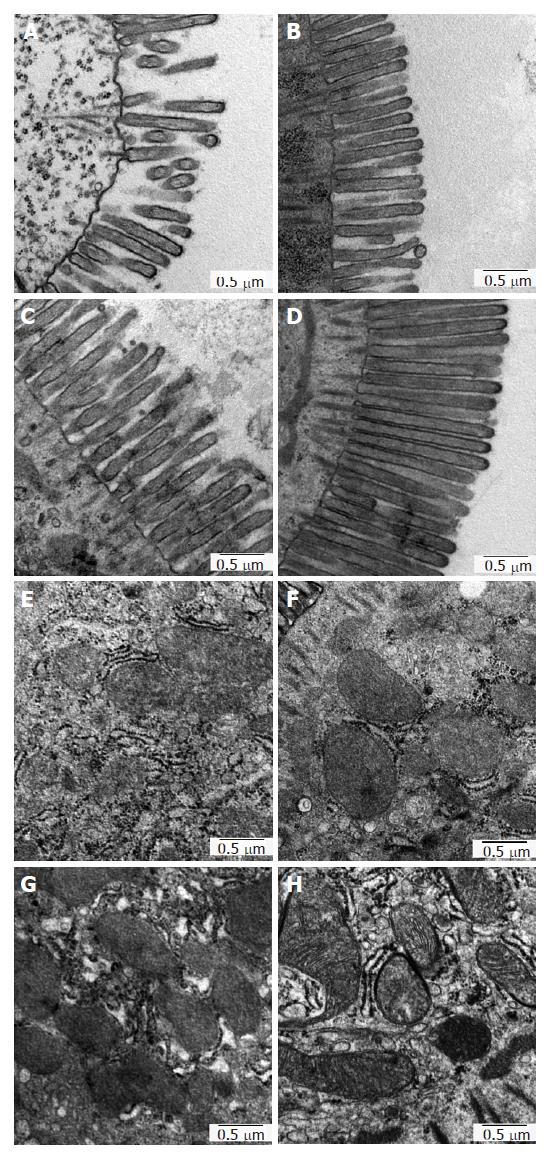
Figure 6 A-D: ultrastructural analysis using electron microscopy, microvilli condition after 18 h CS; E-H: ultrastructural analysis using electron microscopy, mitochondria in enterocytes after 18 h CS.
- Citation: Wei L, Hata K, Doorschodt BM, Büttner R, Minor T, Tolba RH. Experimental small bowel preservation using Polysol: A new alternative to University of Wisconsin solution, Celsior and histidine-tryptophan-ketoglutarate solution? World J Gastroenterol 2007; 13(27): 3684-3691
- URL: https://www.wjgnet.com/1007-9327/full/v13/i27/3684.htm
- DOI: https://dx.doi.org/10.3748/wjg.v13.i27.3684


