Copyright
©2006 Baishideng Publishing Group Co.
World J Gastroenterol. Aug 14, 2006; 12(30): 4773-4783
Published online Aug 14, 2006. doi: 10.3748/wjg.v12.i30.4773
Published online Aug 14, 2006. doi: 10.3748/wjg.v12.i30.4773
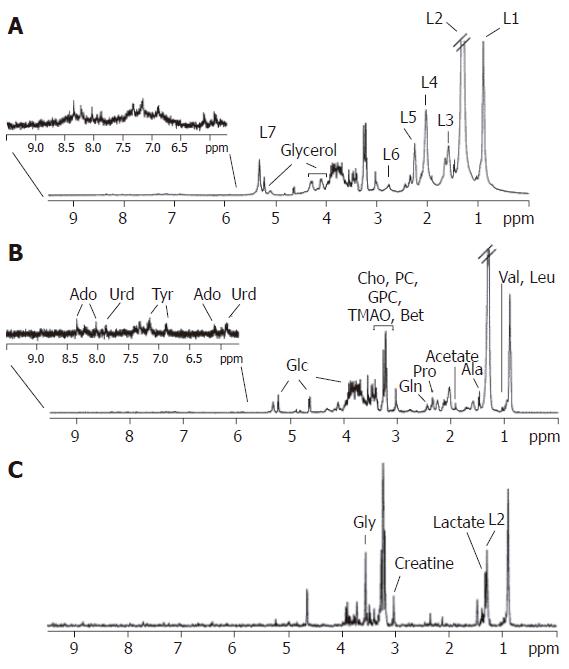
Figure 1 400-MHz 1H HR-MAS NMR spectra of a human liver biopsy sample (rotation rate 4 kHz).
A: Standard 1D spectrum; B: Spin-echo (CPMG) spectrum; C: JRES f2 projection. L1: lipid CH3; L2: lipid (CH2)n; L3: lipid CH2CH2CO; L4: lipid CH2-CH=CH; L5: lipid CH2CO; L6: lipid CH=CH-CH2-CH=CH; L7: lipid CH=CH; Cho: choline; PC: phosphocholine; GPC: glycerophosphocholine; TMAO: trimethylamine-N-oxide; Bet: betaine; Glc: glucose; Val: valine; Leu, leucine; Ala: alanine; Gln: glutamine; Gly: glycine; Tyr: tyrosine; Urd: uridine; Ado: adenosine. Reprinted with permission from Duarte et al Anal Chem 2005; 77: 5570-5578. Copyright (2005) American Chemical Society.
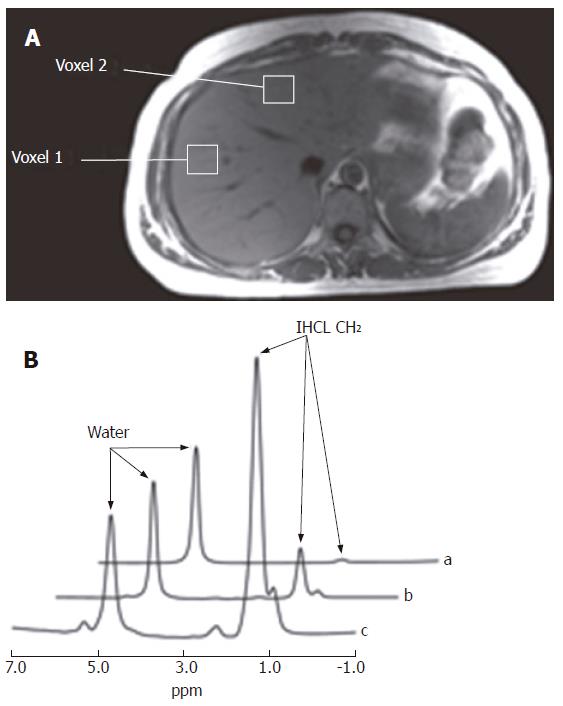
Figure 2 A: A transverse image through the abdomen showing the two voxel positions used to study regional variation in hepatic fat content; B: Typical proton magnetic resonance liver spectra from three volunteers showing progressive degrees of fatty infiltration.
Spectrum (a) shows a liver with minimal fatty infiltration (1.0%), spectrum (b) shows a liver with moderate fatty infiltration (10.2%), and spectrum (c) shows a liver with severe fatty infiltration (74.9%). Resonances from water and IHCL-(CH2)n- can be clearly identified. Values refer to the peak area of the IHCL peak with reference to the water peak after correcting for T1 and T2. IHCL: intrahepatocellular lipids. Reproduced from Thomas et al Gut 2005; 54: 122-127, with permission from the BMJ Publishing Group.
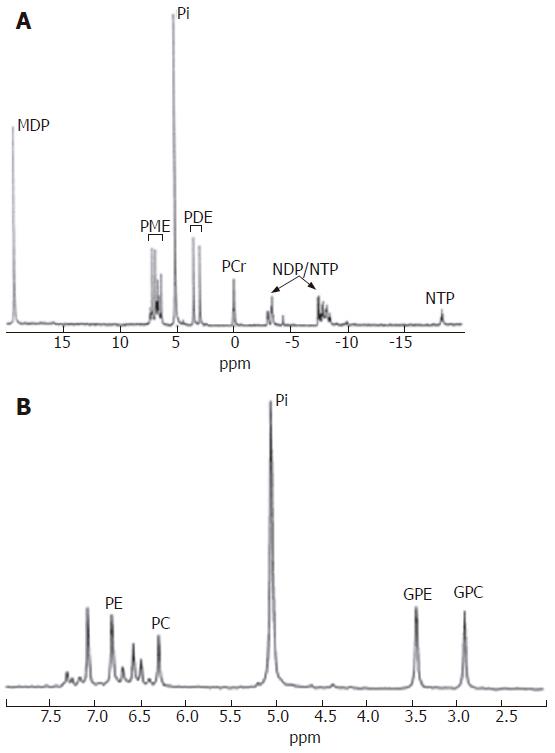
Figure 3 Typical proton decoupled in vitro31P MR spectrum of perchloric acid extracted normal liver tissue.
A: Full spectrum; B: PME and PDE regions. PME: phosphomonoesters; PDE: phosphodiesters; NTP: nucleotide triphosphates; NDP: nucleotide diphosphate; PE: phosphoethanolamine; PC: phosphocholine; GPE: glycerophosphorylethanolamine; GPC: glycerophosphorylcholine; PCr:phosphocreatine; MDP: methylene diphosphonate. Reproduced from Taylor-Robinson et al Gut 1998; 42: 735-743, with permission from the BMJ Publishing Group.
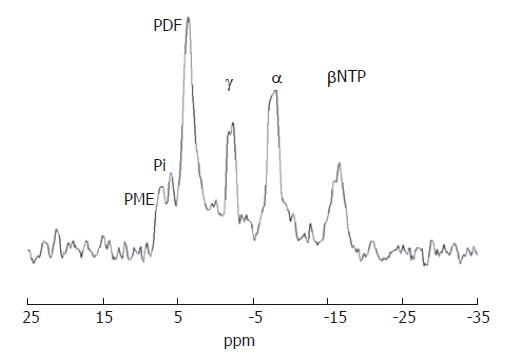
Figure 4 Typical 31P magnetic resonance spectrum from the liver of a healthy volunteer (TR 10 000 ms).
PME: phosphomonoester; Pi: inorganic phosphate; PDE: phosphodiester; NTP: nucleoside triphosphate; ppm: parts per million. Reproduced from Mullenbach et al Gut 2004; 54: 829-834, with permission from the BMJ Publishing Group.
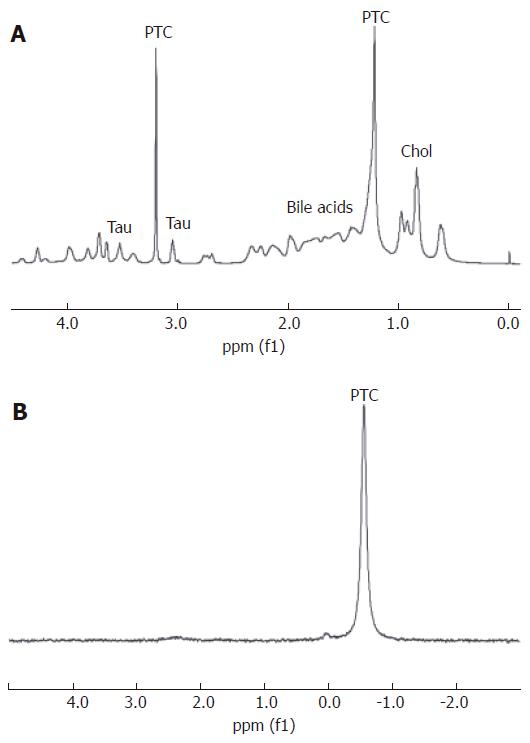
Figure 5 A: 1H nuclear magnetic resonance spectrum of bile collected at laparoscopic cholecystectomy, after a history of recurrent cholecystitis.
The spectrum has no contamination from contrast agents. The major peaks are assigned to phosphatidylcholine (PTC), bile acids, cholesterol (Chol), taurine (Tau) and the reference, sodium trimethylsilyl-[2H4] propionate (TSP); B: Corresponding 31P nuclear magnetic resonance spectrum. The major peak is assigned to PTC. ppm, Parts per million. Reproduced from Khan SA, Cox IJ, Thillainayagam AV, Bansi DS, Thomas HC, Taylor-Robinson SD. Proton and phosphorus-31 nuclear magnetic resonance spectroscopy of human bile in hepatopancreaticobiliary cancer. Eur J Gastroenterol Hepatol 2005; 17: 733-738, with permission from Lippincott Williams & Wilkins, Inc.
- Citation: Cox IJ, Sharif A, Cobbold JF, Thomas HC, Taylor-Robinson SD. Current and future applications of in vitro magnetic resonance spectroscopy in hepatobiliary disease. World J Gastroenterol 2006; 12(30): 4773-4783
- URL: https://www.wjgnet.com/1007-9327/full/v12/i30/4773.htm
- DOI: https://dx.doi.org/10.3748/wjg.v12.i30.4773


