Copyright
©2006 Baishideng Publishing Group Co.
World J Gastroenterol. May 14, 2006; 12(18): 2936-2940
Published online May 14, 2006. doi: 10.3748/wjg.v12.i18.2936
Published online May 14, 2006. doi: 10.3748/wjg.v12.i18.2936
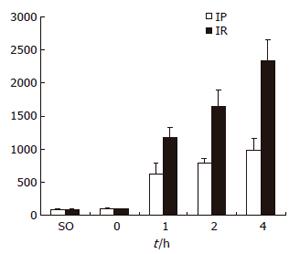
Figure 1 Serum ALT levels SO, IP and IR groups.
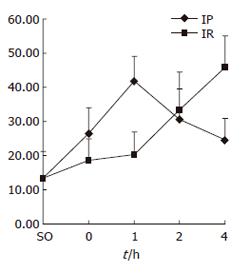
Figure 2 PI in SO, IP and IR groups.
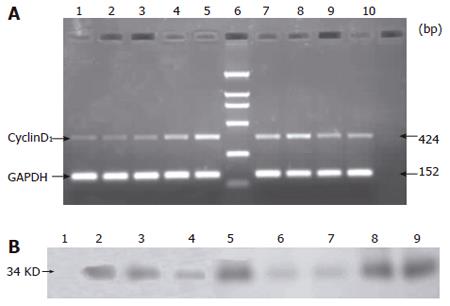
Figure 3 Expression of cyclin D1 mRNA (A) and cyclin D1 protein (B) at different time points in SO, IP and IR groups.
- Citation: Cai FG, Xiao JS, Ye QF. Effects of ischemic preconditioning on cyclinD1 expression during early ischemic reperfusion in rats. World J Gastroenterol 2006; 12(18): 2936-2940
- URL: https://www.wjgnet.com/1007-9327/full/v12/i18/2936.htm
- DOI: https://dx.doi.org/10.3748/wjg.v12.i18.2936


