Copyright
©2006 Baishideng Publishing Group Co.
World J Gastroenterol. Apr 28, 2006; 12(16): 2530-2535
Published online Apr 28, 2006. doi: 10.3748/wjg.v12.i16.2530
Published online Apr 28, 2006. doi: 10.3748/wjg.v12.i16.2530
Figure 1 Sequence alignment of amino acids no 311 to 370 ( numbering starts from initiating methionin in the core protein of genotype 4a) of HCV E1 among representative genotypes.
Eight sequences of different subtypes were aligned using ClustalW software, the output diagram is shown with the legend on the left having the accession number and the subtypes. Sequences shown in bold represent the highly conserved amino acid stretch (GHRMAWDMM) used for production of polyclonal antibody.
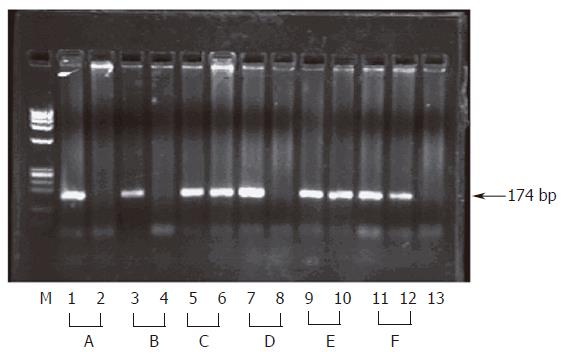
Figure 2 Inhibition of HCV entry into HepG2 cells by anti E1 Ab.
Sera from 6 HCV infected patients (A to F) were used for infection of HepG2 cells before (Lanes 1,3,6,7,9 and 11) and after pre-incubation with anti E1 Ab (Lanes 2,4,6,8,10 and 12). RNA was detected in HepG2 lysates by nested HCV RT-PCR and the products were resolved on 2% agarose gel as described in materials and methods. The presence of a 174 bp band indicates presence of viral RNA while absence of the band indicates successful blocking of viral entry into cells. Lane M shows φx Hae III digest as a molecular weight marker, lane 13 shows RT-PCR of the PBS used for the last wash step of the cells.
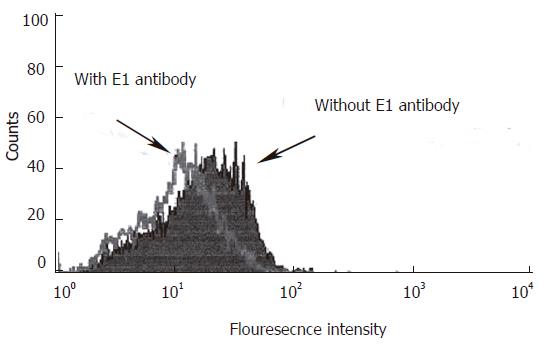
Figure 3 Neutralization of HCV infection into HepG2 cells by anti E1 antibody.
The pretreated sera with anti E1 Ab or with PBS were incubated with HepG2 cells for 90 min at 37 oC in CO2 incubator. Cell pellets were washed with PBS, incubated with FITC labeled F(ab)2 portion of anti E1 Ab and analyzed with flow cytometry as described in Materials and Methods The mean fluorescence intensities decreased from 12.5% in cells incubated with PBS to 2% after treatment with anti E1 Ab using cell Quest software (Becton Dickinson).
- Citation: EL-Awady MK, Tabll AA, Atef K, Yousef SS, Omran MH, El-Abd Y, Bader-Eldin NG, Salem AM, Zohny SF, El-Garf WT. Antibody to E1 peptide of hepatitis C virus genotype 4 inhibits virus binding and entry to HepG2 cells in vitro. World J Gastroenterol 2006; 12(16): 2530-2535
- URL: https://www.wjgnet.com/1007-9327/full/v12/i16/2530.htm
- DOI: https://dx.doi.org/10.3748/wjg.v12.i16.2530


