Copyright
©2006 Baishideng Publishing Group Co.
World J Gastroenterol. Apr 7, 2006; 12(13): 2086-2088
Published online Apr 7, 2006. doi: 10.3748/wjg.v12.i13.2086
Published online Apr 7, 2006. doi: 10.3748/wjg.v12.i13.2086
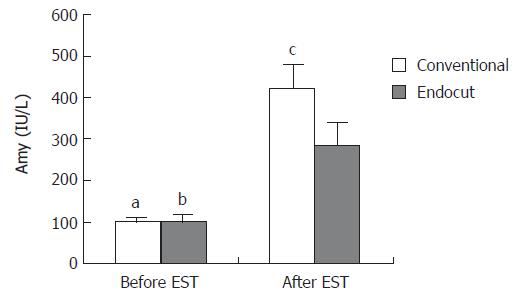
Figure 1 Average serum amylase level before and after EST.
Data are expressed as mean ± SE. aP < 0.02 vs conventional cut group after EST; bP < 0.02 vs endocut group; after EST; cP < 0.05 vs endocut group after EST.
- Citation: Akiho H, Sumida Y, Akahoshi K, Murata A, Ouchi J, Motomura Y, Toyomasu T, Kimura M, Kubokawa M, Matsumoto M, Endo S, Nakamura K. Safety advantage of endocut mode over endoscopic sphincterotomy for choledocholithiasis. World J Gastroenterol 2006; 12(13): 2086-2088
- URL: https://www.wjgnet.com/1007-9327/full/v12/i13/2086.htm
- DOI: https://dx.doi.org/10.3748/wjg.v12.i13.2086


