Copyright
©2005 Baishideng Publishing Group Inc.
World J Gastroenterol. Mar 7, 2005; 11(9): 1273-1282
Published online Mar 7, 2005. doi: 10.3748/wjg.v11.i9.1273
Published online Mar 7, 2005. doi: 10.3748/wjg.v11.i9.1273
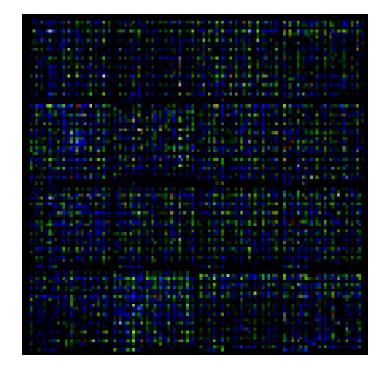
Figure 1 Results of high-density chip hybridization with gastric tissues.
Red and yellow: higher gene expression levels. Green and blue: lower gene expression levels.
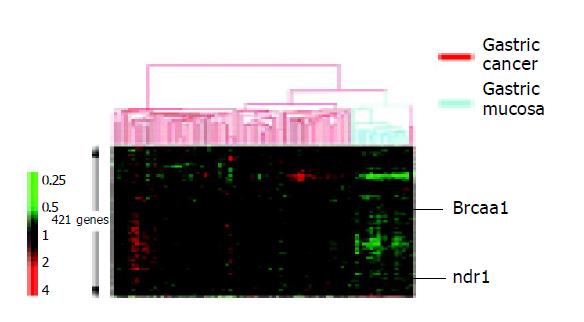
Figure 2 Cluster analysis of low-density-chip-examination results of 150 specimens.
Figure 3 Northern blot analysis of brcaa1 and ndr1.
A: brcaa1: lanes 1, 3, 5: Normal gastric tissues; lanes 2, 4, 6: Gastric cancer tissues; B: ndr1: lanes 1, 3, 5, 7: Gastric cancer tissues; lanes 2, 4, 6: Normal gastric tissues.
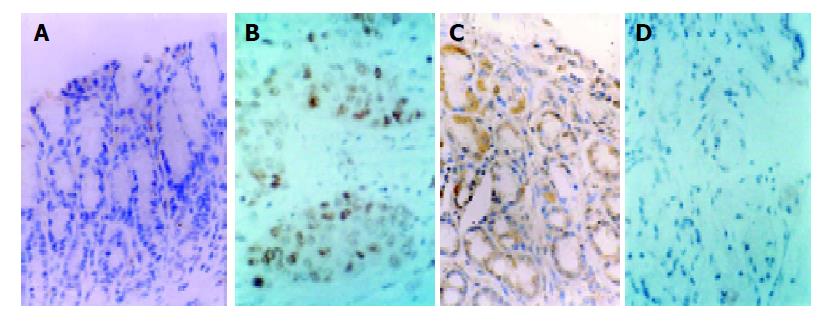
Figure 4 Immunohistochemistry analysis of brcaa1 and ndr1.
A: Brcaa1 expression in normal gastric mucosa tissues (200 size); B: Brcaa1 expression in gastric cancer tissues (400 size); C: Ndr1 expression in normal gastric mucous tissues (200 size); D: Ndr1 expression in gastric cancer tissues (200 size).
- Citation: Cui DX, Zhang L, Yan XJ, Zhang LX, Xu JR, Guo YH, Jin GQ, Gomez G, Li D, Zhao JR, Han FC, Zhang J, Hu JL, Fan DM, Gao HJ. A microarray-based gastric carcinoma prewarning system. World J Gastroenterol 2005; 11(9): 1273-1282
- URL: https://www.wjgnet.com/1007-9327/full/v11/i9/1273.htm
- DOI: https://dx.doi.org/10.3748/wjg.v11.i9.1273


