Copyright
©2005 Baishideng Publishing Group Inc.
World J Gastroenterol. Dec 21, 2005; 11(47): 7418-7429
Published online Dec 21, 2005. doi: 10.3748/wjg.v11.i47.7418
Published online Dec 21, 2005. doi: 10.3748/wjg.v11.i47.7418
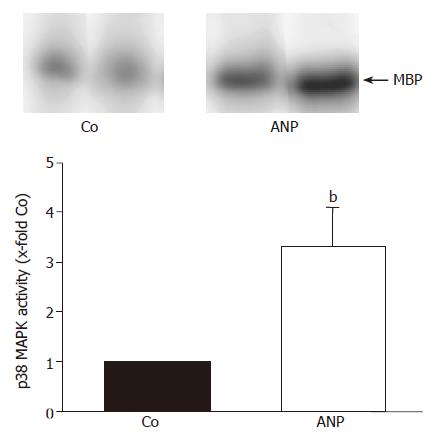
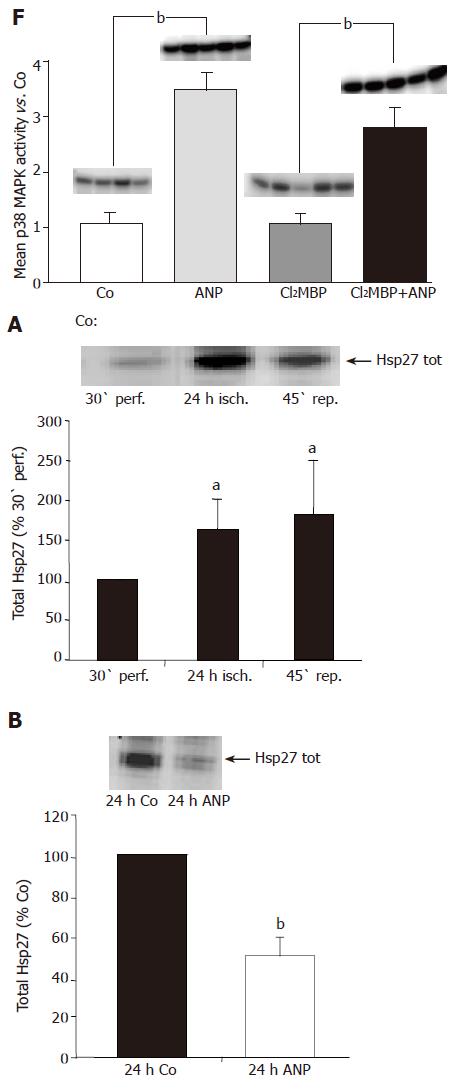
Figure 1 Effect of ANP pretreatment on p38 MAPK activity.
After intravenous infusion of ANP (5 μg/kg) or NaCl (Co) for 20 min livers were snap-frozen and homogenized in lysis buffer. Following immunoprecipitation, the assay was performed as described in “Materials and methods”, and samples were separated by SDS-PAGE. One representative kinase activity assay specific for p38 MAPK is shown with n = 2 (out of n = 4) for each treatment group. p38 MAPK activity in the liver homogenates is presented as 10-fold control (30-min perfusion), and is expressed as mean±SE of n = 4 experiments in each treatment group. bP<0.01 vs control.
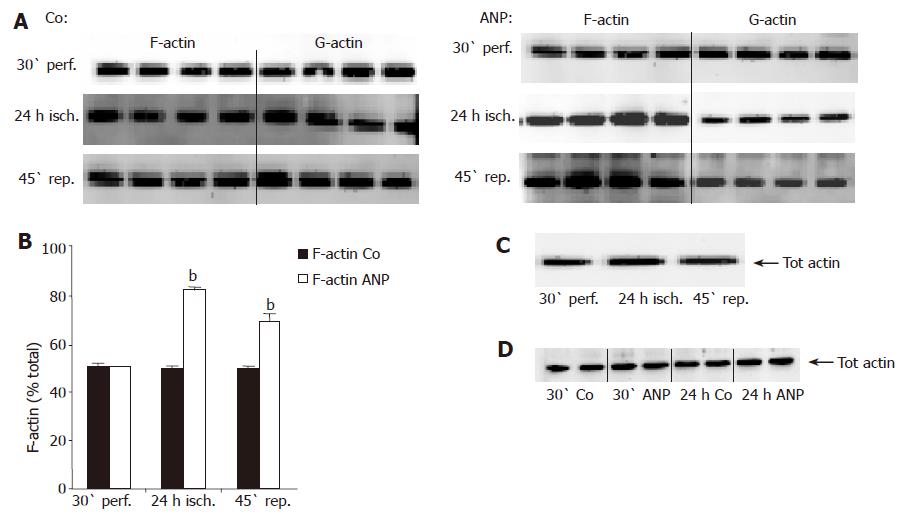
Figure 2 Influence of ANP preconditioning and ischemia on total actin and F-actin content.
Livers were perfused for 30 min in the absence or presence of 200 nmol/L ANP, which was added 20 min prior to ischemia. Afterwards, livers were kept under ischemic conditions for 24 h (4 °C) in UW solution. At the indicated times, livers were snap-frozen, homogenized, and analyzed by Western blot using an anti-actin antibody. For differentiation between F- and G-actin (cytoskeleton and cytosol, respectively), liver homogenates were fractionated before Western blot analysis according to “Materials and methods” (A and B). One representative Western blot is imaged for each experimental setting. (A) Western blots representing hepatic F- and G-actin content during IR in untreated (Co) and ANP-preconditioned livers after 30-min perfusion (30' perf.), 24-h ischemia (24-h isch.), and 45-min reperfusion (45' rep.). (B) Quantitative/densitometric analysis of F- and G-actin content during IR in untreated (Co) or ANP-preconditioned livers. Data are expressed as percent of total actin content (F-actin+G-actin=100%) as mean±SE of n = 4 experiments in each treatment group. bP<0.001 vs appropriate control. (C) Western blot showing total actin in untreated liver homogenates after 30-min perfusion, 24-h ischemia, and 45-min reperfusion. (D) Total hepatic actin content after perfusion (30') and ischemia (24-h) in ANP treated or untreated (Co) livers detected by Western blot analysis.
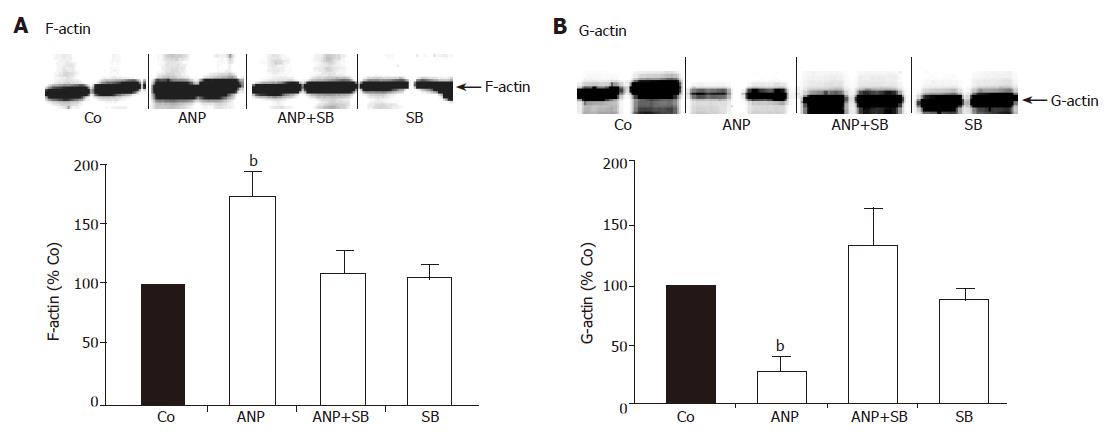
Figure 3 Effect of p38 MAPK inhibition on distribution of F- and G-actin.
20 min prior to ischemia livers were preconditioned with 200 nmol/L ANP or left untreated (Co) followed by 24-h ischemia at 4 °C. In different experiments, livers were perfused with SB203580 (2 μmol/L) or with a combination of SB203580 (2 μmol/L) and ANP (200 nmol/L). After ischemia livers were snap-frozen, homogenized and divided into cytoskeletal (A) and cytosolic (B) fraction by fractionation as described above. Samples were analyzed by Western blotting using an anti-actin antibody for detection of F-actin (A) in the cytoskeletal fraction and G-actin (B) in the cytosolic fraction. One representative Western blot is shown for each fraction. Bars show percentage of hepatic F-actin (A) or G-actin (B) in ANP, ANP+SB203580 and SB203580 treated livers referring to untreated control livers. Results are expressed as mean±SE of n = 4 experiments in each treatment group. bP<0.01 vs control after 24-h ischemia.
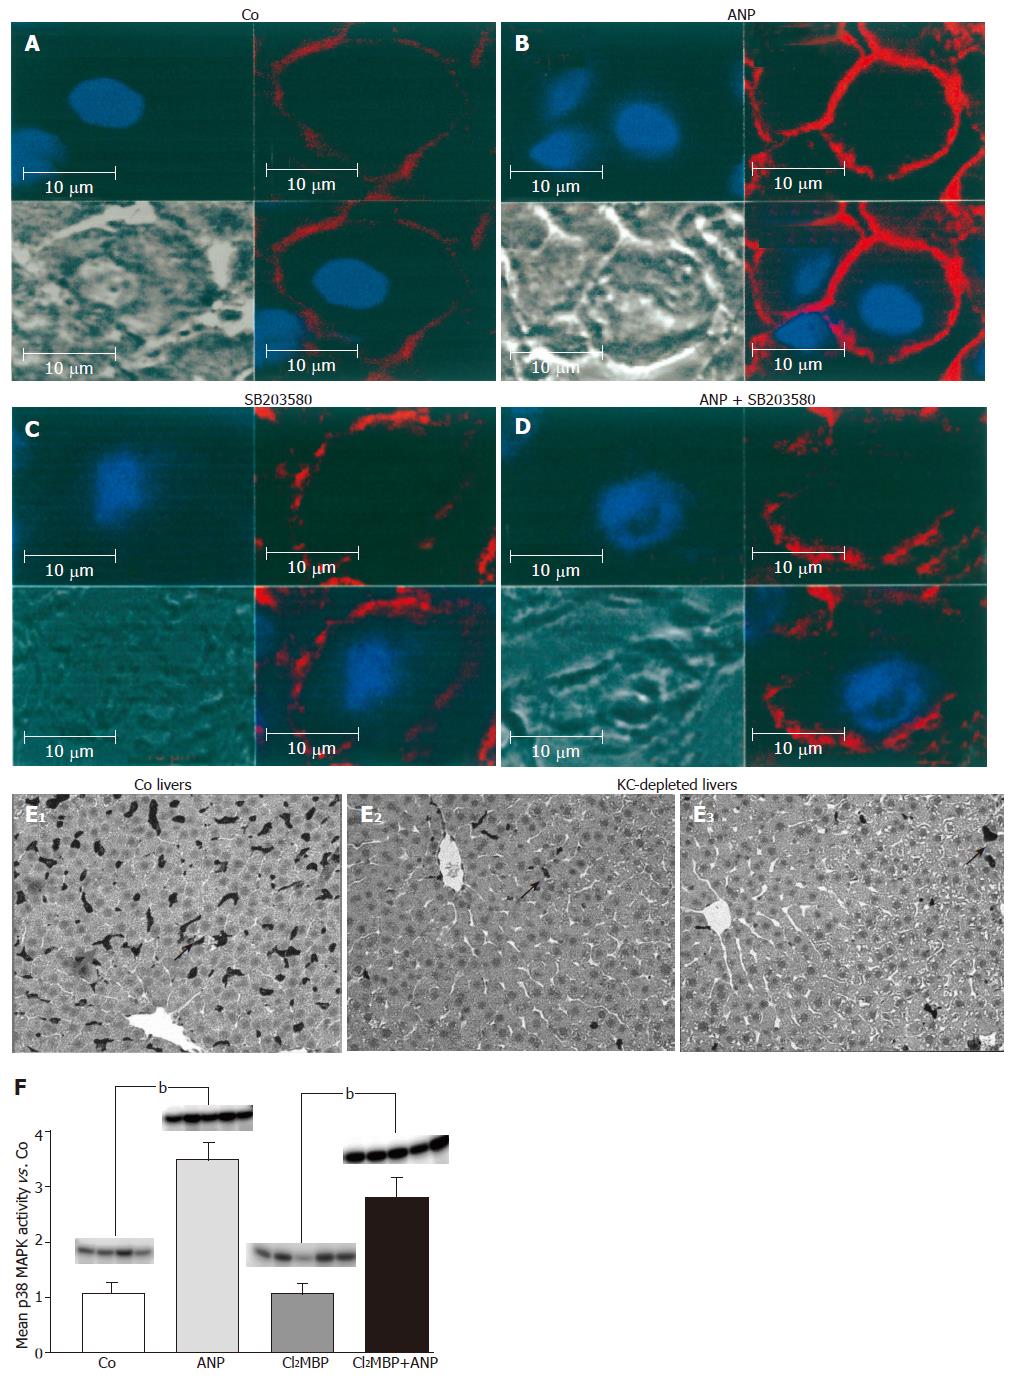
Figure 4 Analysis of the influence of ANP preconditioning on localization of F-actin in the liver by confocal microscopy.
Livers were left untreated (A): preconditioned with 200 nmol/L ANP (B): 2 μmol/L SB203580 (C): or perfused with a combination of ANP (200 nmol/L) and SB203580 (2 μmol/L) (D): After ischemia (24 h, 4 °C), livers were snap-frozen, cut into 6-μm slices and stained with rhodamine-conjugated phalloidin (red, F-actin) and Hoechst 33342 (blue, nuclei) as described in “Materials and methods”. Liver sections were observed by confocal laser microscopy (63-fold amplification). Immunohistological staining of KCs in untreated (Co) and KC-depleted livers (E): rats received an intravenous injection of 900 µL NaCl (Co) or 900 µL liposomes (12 mmol/L Cl2MBP) into the tail vein. After 48 h rat livers were perfused, snap-frozen and liver slices were stained with an antibody against the KC-specific surface marker ED2 (see “Methods”) to verify the Cl2MBP-dependent depletion of the KCs. Dark staining represents KC (hallmarked with arrows). (F): KCs were depleted with Cl2MBP as described under “Methods”. After 48 h control organs (Co) or KC-depleted livers (12 mmol/L Cl2MBP) were perfused±ANP (200 nmol/L) for 20 min. Then p38 MAPK activity was investigated by in vitro phosphorylation assay (see “Methods”). Determination of density light units was performed by phosphorimaging and values of ANP-pretreated cells were divided by mean values of the respective control group. Columns show mean±SE of 4-5 independent perfusion experiments with bP<0.01 being statistically different from the respective control group.
Figure 5 Changes in hepatic total Hsp27 during ischemia – influence of ANP pretreatment.
Livers were perfused for 30 min in the presence or absence of ANP followed by 24-h ischemia at 4 °C in UW solution and reperfusion for 45 min. Afterwards, livers were snap-frozen at the indicated times, homogenized and analyzed via Western blot using an anti-Hsp27 antibody for detection of total Hsp27. One representative Western blot is shown for each experimental setting (untreated controls: (A), ANP pretreated livers: (B)). (A) Effect of IR on total Hsp27 in the liver. The graph shows percentage of values for untreated livers (Co) after 30-min perfusion (30' perf.) as means±SE of n = 4 experiments in each group. aP<0.05 vs untreated control after 30-min perfusion. (B) Influence of ANP preconditioning on total Hsp 27 after 24-h ischemia. Bars represent total Hsp27 as % Co after 24-h ischemia. Data are expressed as means±SE of n = 4 experiments in each treatment group. bP<0.01 vs control after 24-h ischemia.
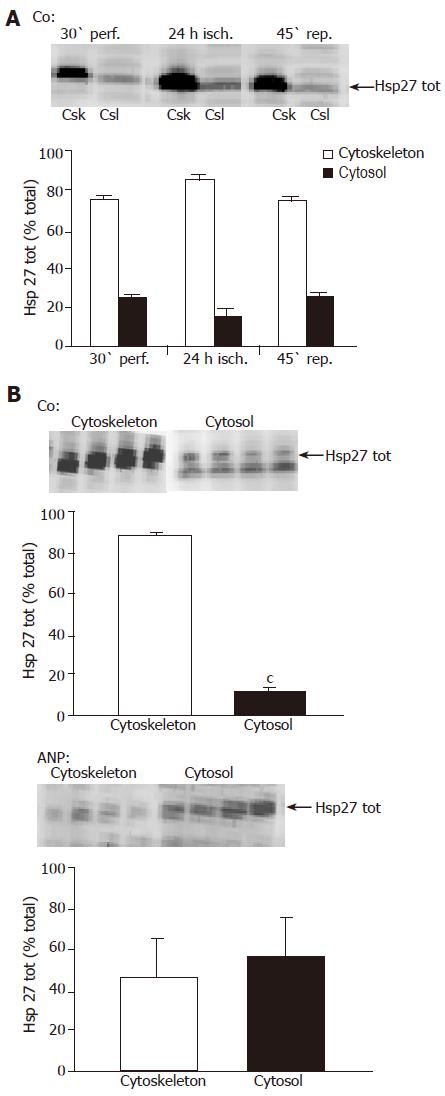
Figure 6 Influence of ischemia and ANP pretreatment on Hsp27 distribution.
After perfusion for 30 min in the absence (A and B) or presence (B) of ANP, 24-h ischemia in cold UW solution, and reperfusion for 45 min, livers were snap-frozen, homogenized and fractionated as described in “Materials and methods“. Samples were taken at indicated times and total Hsp27 in cytoskeletal (Csk) and cytosolic (Csl) fraction was detected via Western blot analysis using an anti-Hsp27 antibody. One representative Western blot is shown for each treatment group. (A) Effect of ischemia and reperfusion on the distribution of total Hsp27 in the liver. Quantification of total Hsp27 in the liver samples was verified via densitometric analysis of the corresponding bands, which was used to evaluate the ratio of Hsp27 in the cytoskeletal fraction (Csk) resp. cytosolic fraction (Csl) referring to total Hsp27 signal (cytoskeleton+cytosol) in the respective sample. Data are expressed as percent of total Hsp27 in cytoskeletal (F-actin) and cytosolic (G-actin) fraction as mean±SE of n=4 experiments in each treatment group. aP<0.05, vs Hsp27 content in cytoskeletal fraction in untreated livers after 30-min perfusion. (B) Distribution of total Hsp27 in untreated (control) and ANP-preconditioned livers after 24-h ischemia. Results are shown as percent of total Hsp27 in cytosolic and cytoskeletal fraction. Data are presented as mean±SE of n=4 experiments in each treatment group. cP<0.001 vs Hsp27 content in cytoskeletal fraction of untreated livers after 24-h ischemia. In ANP treated livers the differences in the values were not significant.
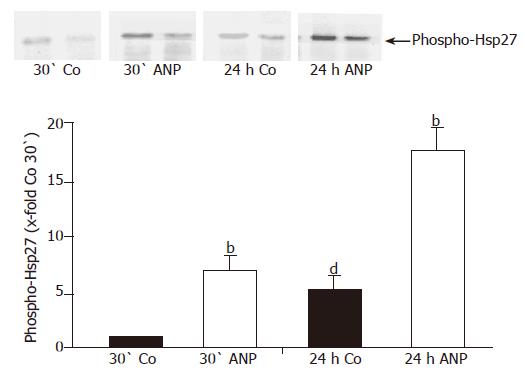
Figure 7 Influence of pretreatment with ANP on phosphorylation status of Hsp27.
After perfusion for 10 min with KH-buffer livers were preconditioned with ANP for 20 min or left untreated, followed by 24-h ischemia (4 °C) according to the study protocol. Samples were taken after 30-min perfusion and 24-h ischemia. Livers were snap-frozen and homogenized, followed by immunoprecipitation with an anti-Hsp27 antibody and Western blot analysis using an anti-phospho-Hsp27 antibody. One representative Western blot is shown. Content of phospho-Hsp27 in the liver homogenates is presented as 10-fold control after 30-min perfusion, using the respective control as reference value and expressed as mean±SE of n = 4 experiments in each treatment group. Statistical analysis of ANP pretreated samples: bP<0.001 vs phospho-Hsp27 in respective control (after 30-min perfusion or 24-h ischemia). Statistical analysis of untreated control samples: dP<0.01 vs phospho-Hsp27 in control after 30-min perfusion.
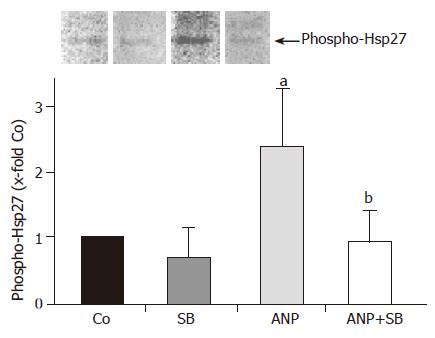
Figure 8 Effect of p38 MAPK inhibition on phosphorylation status of Hsp27.
Livers were perfused for 30 min in the absence (Co) or presence of 200 nmol/L ANP, which was added 20 min prior to 24-h ischemia (4 °C). In different experiments, livers were perfused for 20 min with SB203580 (2 μmol/L) or with a combination of SB203580 (2 μmol/L) and ANP (200 nmol/L). After ischemia, livers were snap-frozen and homogenized. Total Hsp27 was precipitated as described and the content of phosphorylated Hsp27 was determined by Western blotting and detection with anti-phospho-Hsp27 primary antibody. One representative Western blot is shown. In the graph hepatic content of phospho-Hsp27 is expressed as percent of control samples after 24-h ischemia as mean±SE of n = 4 experiments in each treatment group. aP<0.05 vs control after 24-h ischemia, bP<0.01 vs phospho-Hsp27 content in ANP pretreated livers.
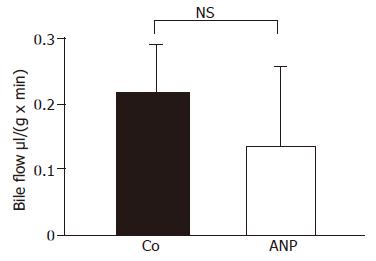
Figure 9 Effect of ANP preconditioning on bile flow.
Bile was collected during perfusion and reperfusion and quantified volumetrically. Bile flow is expressed as μL per min and g liver tissue. Results show mean±SE of n = 4 experiments in each treatment group. The differences between untreated (Co) and ANP-preconditioned group were not significant.
- Citation: Keller M, Gerbes AL, Kulhanek-Heinze S, Gerwig T, Grützner U, Rooijen NV, Vollmar AM, Kiemer AK. Hepatocyte cytoskeleton during ischemia and reperfusion - influence of ANP-mediated p38 MAPK activation. World J Gastroenterol 2005; 11(47): 7418-7429
- URL: https://www.wjgnet.com/1007-9327/full/v11/i47/7418.htm
- DOI: https://dx.doi.org/10.3748/wjg.v11.i47.7418


