Copyright
©2005 Baishideng Publishing Group Inc.
World J Gastroenterol. Dec 21, 2005; 11(47): 7413-7417
Published online Dec 21, 2005. doi: 10.3748/wjg.v11.i47.7413
Published online Dec 21, 2005. doi: 10.3748/wjg.v11.i47.7413
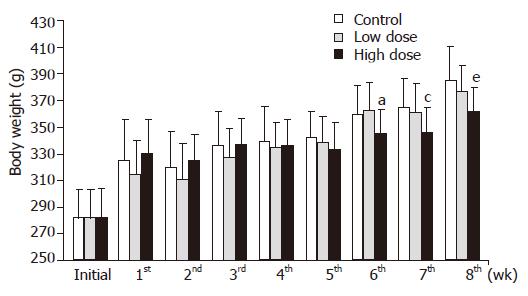
Figure 1 Effect of synbiotics on body weight changes in rats.
All results are expressed as mean and standard errors of 16 rats. aP<0.05 vs control, cP<0.05 vs control, eP<0.05 vs control.
Figure 2 Effect of synbiotics on fecal weight and moisture in rats.
All results are expressed as mean and standard errors of 16 rats. Feces were collected at the last one week of the experimental period. aP<0.05 vs control, cP<0.05 vs control (A and B).
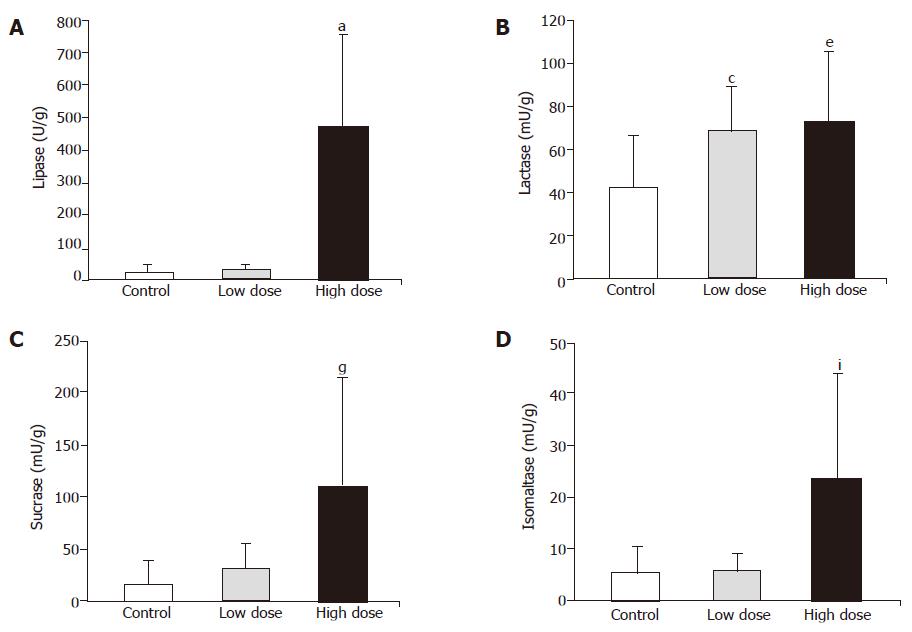
Figure 3 Effect of synbiotics on jejunal digestive enzyme activities in rats.
All results are expressed as mean and standard errors of 16 rats. aP<0.05 vs control, cP<0.05 vs control, eP<0.05 vs control, gP<0.05 vs control, iP<0.05 vs control (A, B, C, D).
- Citation: Yang SC, Chen JY, Shang HF, Cheng TY, Tsou SC, Chen JR. Effect of synbiotics on intestinal microflora and digestive enzyme activities in rats. World J Gastroenterol 2005; 11(47): 7413-7417
- URL: https://www.wjgnet.com/1007-9327/full/v11/i47/7413.htm
- DOI: https://dx.doi.org/10.3748/wjg.v11.i47.7413


