Copyright
©2005 Baishideng Publishing Group Inc.
World J Gastroenterol. Jan 28, 2005; 11(4): 605-608
Published online Jan 28, 2005. doi: 10.3748/wjg.v11.i4.605
Published online Jan 28, 2005. doi: 10.3748/wjg.v11.i4.605
Figure 1 Correlations between plasma concentrations of IL-18 and values of A: CAI (r = 0.
56, P = 0.02); B: DAI (r = 0.54, P = 0.03); C: endoscopic score (r = 0.62, P = 0.01).
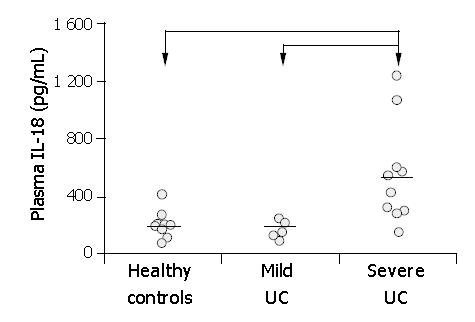
Figure 2 Individual plasma IL-18 concentrations in healthy controls and UC patients with a mild or a severe form of the disease.
Statistical significance between severe UC and mild UC as well as a control is indicated by arrows (P<0.05). Horizontal bar denotes the mean IL-18 concentration [pg/mL] in each of studied groups.
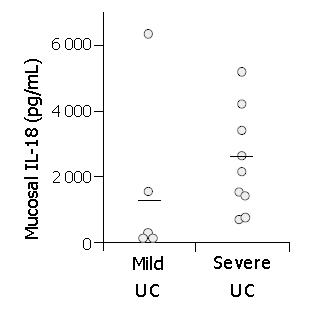
Figure 3 Individual mucosal IL-18 concentrations in UC patients with mild or severe form of the disease.
Horizontal bar denotes mean IL-18 concentration [pg/mL] in each of studied groups (the difference is not statistically significant).
- Citation: Wiercinska-Drapalo A, Flisiak R, Jaroszewicz J, Prokopowicz D. Plasma interleukin-18 reflects severity of ulcerative colitis. World J Gastroenterol 2005; 11(4): 605-608
- URL: https://www.wjgnet.com/1007-9327/full/v11/i4/605.htm
- DOI: https://dx.doi.org/10.3748/wjg.v11.i4.605


