Copyright
©The Author(s) 2005.
World J Gastroenterol. Sep 28, 2005; 11(36): 5677-5684
Published online Sep 28, 2005. doi: 10.3748/wjg.v11.i36.5677
Published online Sep 28, 2005. doi: 10.3748/wjg.v11.i36.5677
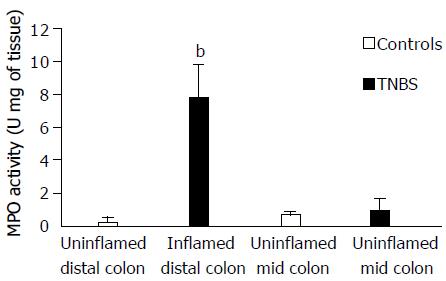
Figure 1 Colonic MPO activity in TNBS and control rats.
bP < 0.01 vs controls distal colon.
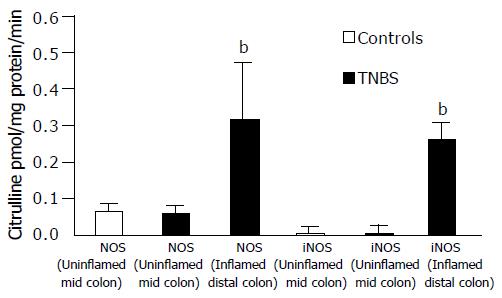
Figure 2 NOS activity in different colon segments in TNBS and control rats.
bP < 0.01 vs uninflamed mid-colon.
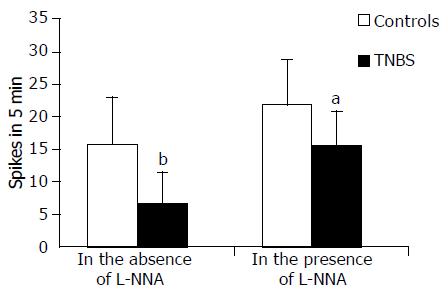
Figure 3 Frequency of phasic contractions of mid-colon circular muscle in controls compared to DUMC of TNBS rats.
aP < 0.05 vs controls, bP < 0.01 vs controls.
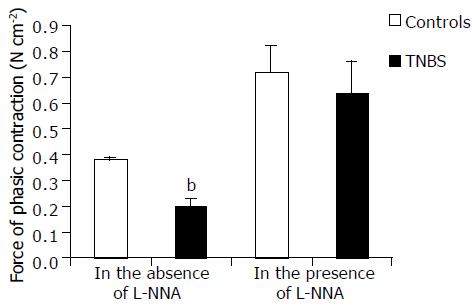
Figure 4 Force of phasic contractions of mid-colon circular muscle in controls compared to DUMC of TNBS rats.
bP < 0.01 vs controls.
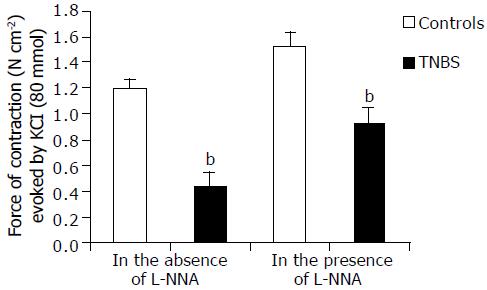
Figure 5 High [K+]0 induced contractile response of mid -colon circular muscle in controls compared to DUMC of TNBS rats.
bP < 0.001 vs controls.
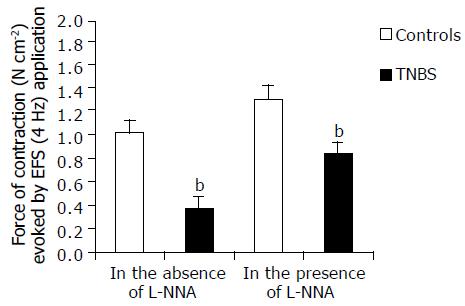
Figure 6 EFS evoked contraction of mid-colon circular muscle in controls compared to DUMC of TNBS rats.
bP < 0.001 vs controls.
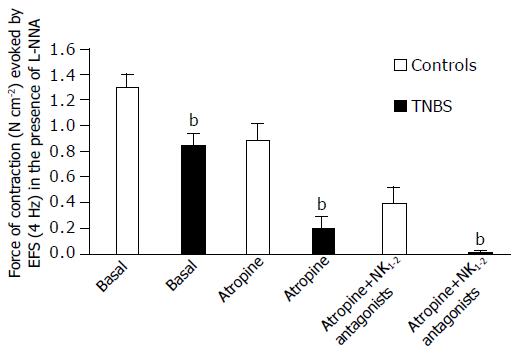
Figure 7 Pharmacological effects on EFS-evoked contractile responses recorded in the presence of L-NNA.
bP < 0.001 vs controls.
- Citation: Onori L, Aggio A, D’Alo’ S, Muzi P, Cifone MG, Mellillo G, Ciccocioppo R, Taddei G, Frieri G, Latella G. Role of nitric oxide in the impairment of circular muscle contractility of distended, uninflamed mid-colon in TNBS-induced acute distal colitis in rats. World J Gastroenterol 2005; 11(36): 5677-5684
- URL: https://www.wjgnet.com/1007-9327/full/v11/i36/5677.htm
- DOI: https://dx.doi.org/10.3748/wjg.v11.i36.5677


