Copyright
©The Author(s) 2005.
World J Gastroenterol. Jul 28, 2005; 11(28): 4326-4331
Published online Jul 28, 2005. doi: 10.3748/wjg.v11.i28.4326
Published online Jul 28, 2005. doi: 10.3748/wjg.v11.i28.4326
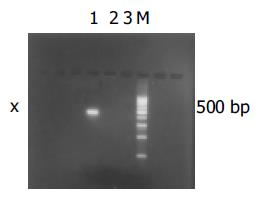
Figure 1 (PDF) Expression of HBV X mRNA in HepG2 cells.
M: 100-bp DNA ladder; lane 1: HepG2/pcDNA3-X cells; lane 2: HepG2/pcDNA3 cells; lane 3: HepG2 cells.
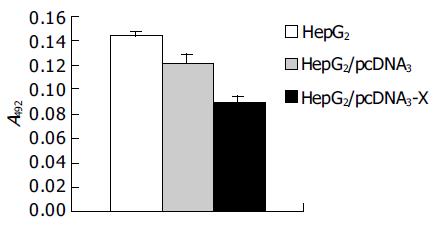
Figure 2 (PDF) Effect of HBx on cell viability in HepG2 cells.
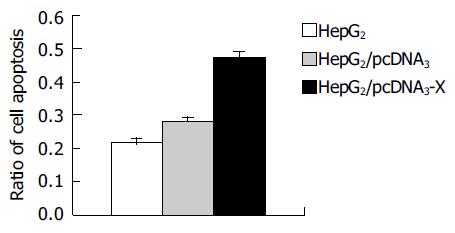
Figure 3 (PDF) Effect of HBx on apoptosis of HepG2 cells.
Figure 4 (PDF) Apoptosis in HepG2/pcDNA3-X ( A), HepG2/pcDNA3 ( B), and HepG2 ( C) cells.
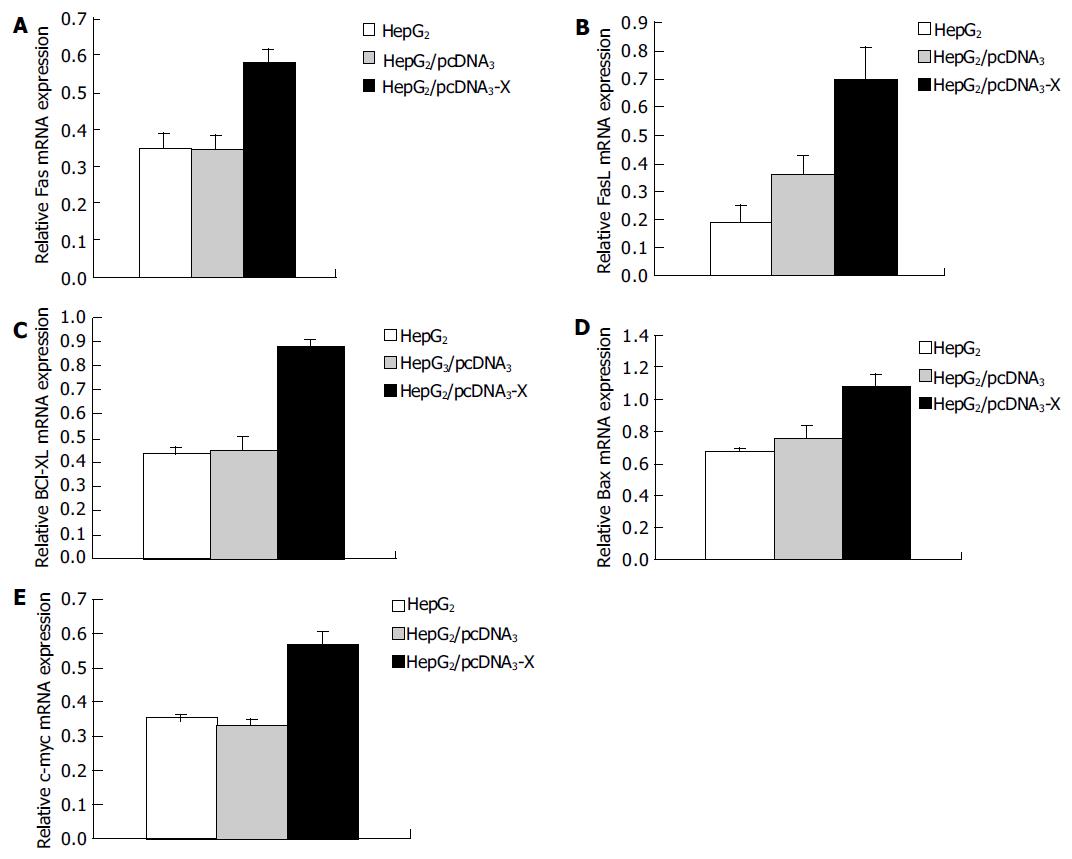
Figure 5 (PDF) RT-PCR results of mRNA expression of Fas ( A), FasL ( B), Bcl-Xl ( C), Bax ( D), and c-myc ( E) in HepG2.
M: 100-bp DNA ladder; lane 1: HepG2 cells; lane 2: HepG2/pcDNA3 cells; lane 3: HepG2/pcDNA3-X cells.
Figure 6 (PDF) Relative mRNA expression levels of Fas ( A), FasL ( B), Bcl-Xl ( C), Bax ( D), and c-myc ( E) in HepG2 cells.
- Citation: Lin N, Chen HY, Li D, Zhang SJ, Cheng ZX, Wang XZ. Apoptosis and its pathway in X gene-transfected HepG2 cells. World J Gastroenterol 2005; 11(28): 4326-4331
- URL: https://www.wjgnet.com/1007-9327/full/v11/i28/4326.htm
- DOI: https://dx.doi.org/10.3748/wjg.v11.i28.4326


