Copyright
©2005 Baishideng Publishing Group Inc.
World J Gastroenterol. Jun 7, 2005; 11(21): 3212-3216
Published online Jun 7, 2005. doi: 10.3748/wjg.v11.i21.3212
Published online Jun 7, 2005. doi: 10.3748/wjg.v11.i21.3212
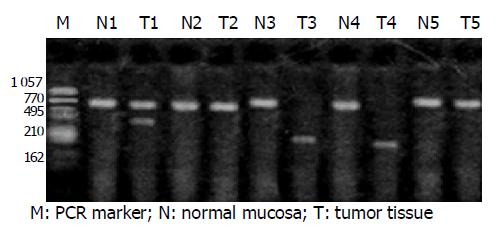
Figure 1 Deletion of FHIT gene in gastric cancer.
Lanes T3 and T4 show truncated FHIT gene.
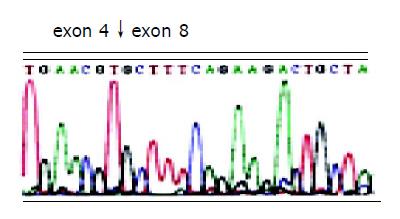
Figure 2 Sequencing analysis of abnormal FHIT gene expression.
Arrow indicates the splicing joint of FHIT gene exons 4 and 8.
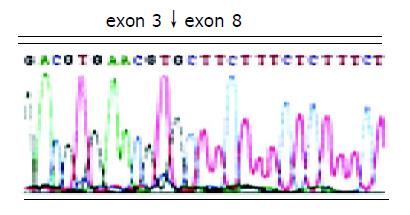
Figure 3 Sequencing analysis of abnormal FHIT gene expression.
Arrow indicates the splicing joint of FHIT gene exons 3 and 8.
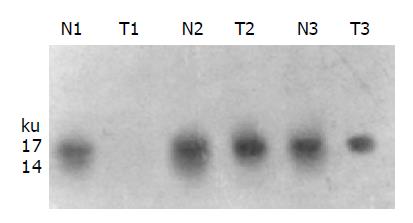
Figure 4 Expression of FHIT protein in gastric cancer.
Lane T1 shows the deletion of FHIT protein. N: normal; T: tumor.
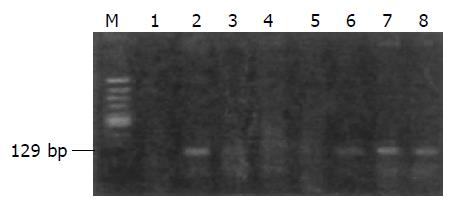
Figure 5 Electrophoresis result of EBV in gastric cancer.
Lanes 2, 6-8 show the positive EBV infection.
- Citation: Xiao YP, Han CB, Mao XY, Li JY, Xu L, Ren CS, Xin Y. Relationship between abnormality of FHIT gene and EBV infection in gastric cancer. World J Gastroenterol 2005; 11(21): 3212-3216
- URL: https://www.wjgnet.com/1007-9327/full/v11/i21/3212.htm
- DOI: https://dx.doi.org/10.3748/wjg.v11.i21.3212


