Copyright
©2005 Baishideng Publishing Group Inc.
World J Gastroenterol. Apr 7, 2005; 11(13): 1965-1970
Published online Apr 7, 2005. doi: 10.3748/wjg.v11.i13.1965
Published online Apr 7, 2005. doi: 10.3748/wjg.v11.i13.1965
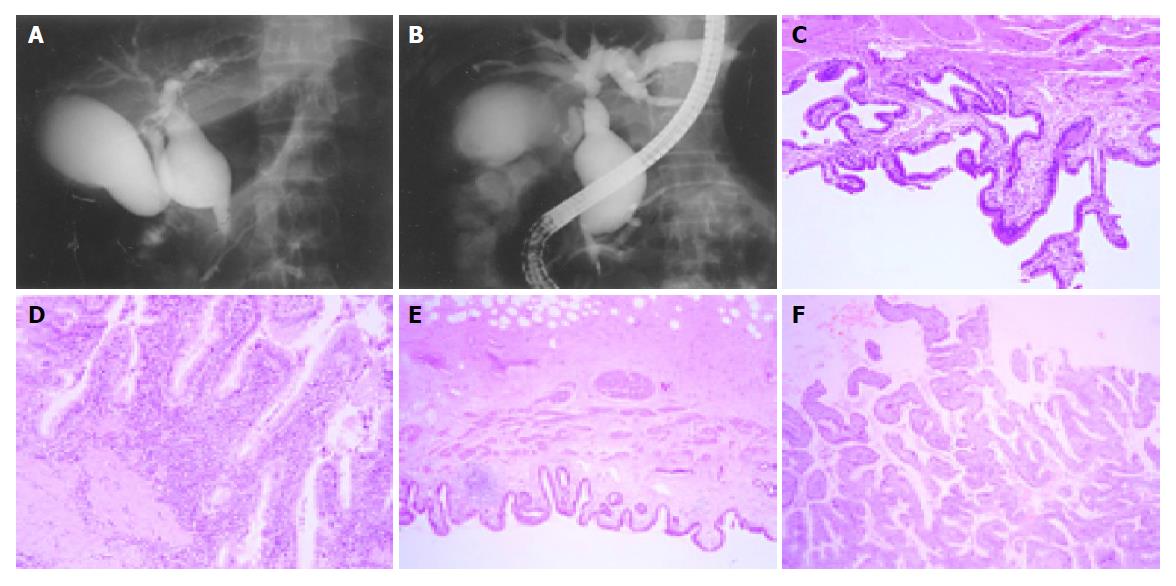
Figure 1 Endoscopic retrograde cholangiopancreatogram of choledochal cyst and microscopic change of extrahepatic bile duct.
A: Todani type I and APBDU; B: Todani type IVa and APBDU; C: infiltration of small number of lymphocytes (inflammatory grade I); D: extensive infiltration of lymphocytes with surface erosion (inflammatory grade III); E: papillary epithelial growth, less than one-third (hyperplasia grade I); F: papillary epithelial growth, more than two-thirds (hyperplasia grade III).
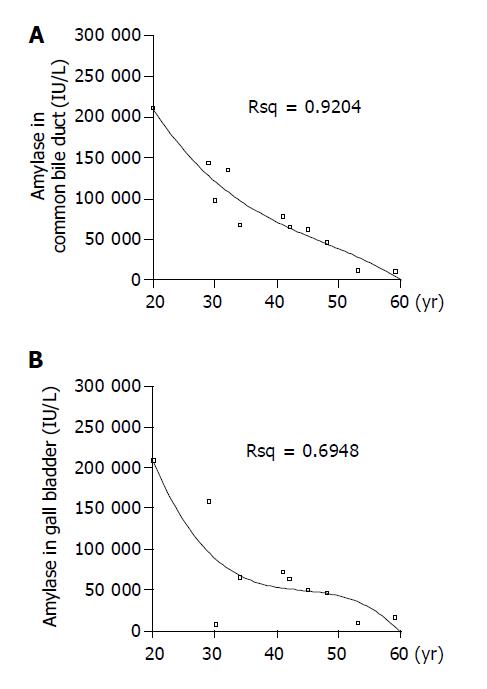
Figure 2 Correlation between the age of symptomatic onset and bile duct amylase (n = 11) or gall bladder amylase (n = 10).
A: There was highly significant correlation between age and level of amylase in bile duct; that is, the level of biliary amylase decreased with increasing age of onset (r = –0.982, P<0.01); B: in gall bladder (r = –0.636, P<0.05).
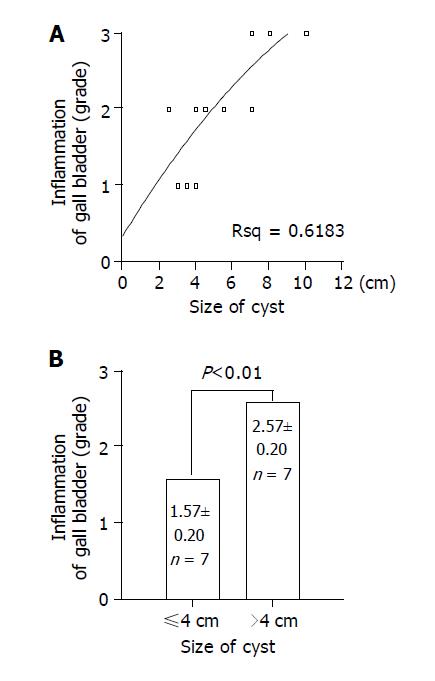
Figure 3 Correlation between grade of inflammation and size of cyst (n = 14).
A: There was significant correlation between inflammation grade and size of choledochal cyst (r = 0.798, P<0.01); B: When the size was grouped by 4 cm, statistical significance was more remarkable (P<0.01).
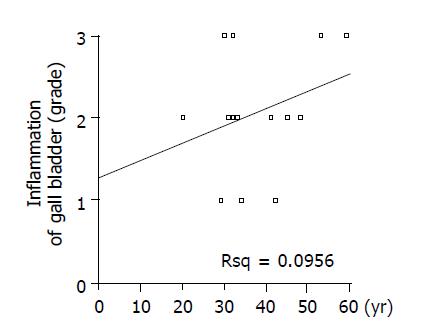
Figure 4 Relationship between the age of symptomatic onset and grade of inflammation (n = 14).
There was no correlation between the age and the grade of inflammation (r = 0.205, P>0.05).
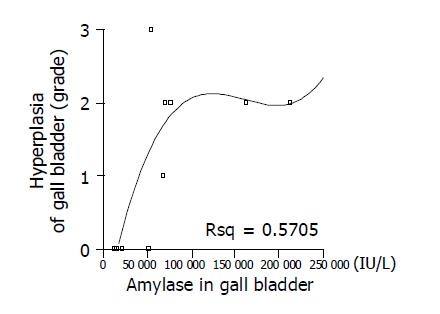
Figure 5 Correlation between grade of hyperplasia and gall bladder amylase (n = 11).
There was significant correlation between the grade of hyperplasia and gall bladder amylase; that is, the grade of hyperplasia increased with increasing the gall bladder amylase (r = 0.743, P<0.05).
- Citation: Jeong IH, Jung YS, Kim H, Kim BW, Kim JW, Hong J, Wang HJ, Kim MW, Yoo BM, Kim JH, Han JH, Kim WH. Amylase level in extrahepatic bile duct in adult patients with choledochal cyst plus anomalous pancreatico-biliary ductal union. World J Gastroenterol 2005; 11(13): 1965-1970
- URL: https://www.wjgnet.com/1007-9327/full/v11/i13/1965.htm
- DOI: https://dx.doi.org/10.3748/wjg.v11.i13.1965


