Copyright
©The Author(s) 2004.
World J Gastroenterol. Mar 1, 2004; 10(5): 630-633
Published online Mar 1, 2004. doi: 10.3748/wjg.v10.i5.630
Published online Mar 1, 2004. doi: 10.3748/wjg.v10.i5.630
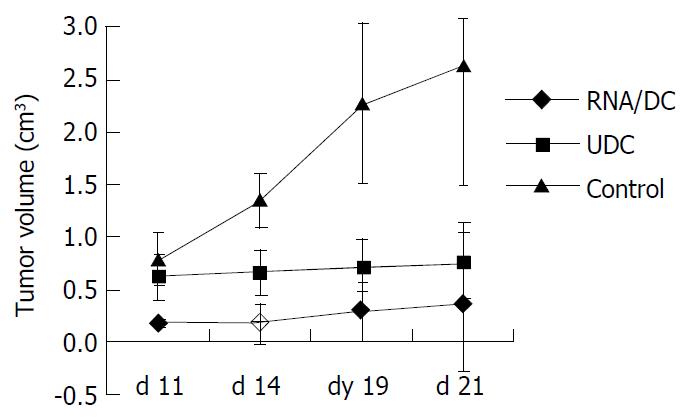
Figure 1 Tumor growth curve.
Control group mice (n = 12) were inoculated sc with 5 × 10⁵ MFC gastric cancer cells without any immunization. UDC group mice (n = 10) were immunized twice with unpulsed DCS followed by inoculation sc with 5 × 10⁵ MFC gastric cancer cells. RNA/DC group mice (n = 12) were immu-nized twice with RNA pulsed DCs followed by inoculation s c with 5 × 10⁵ MFC gastric cancer cells.
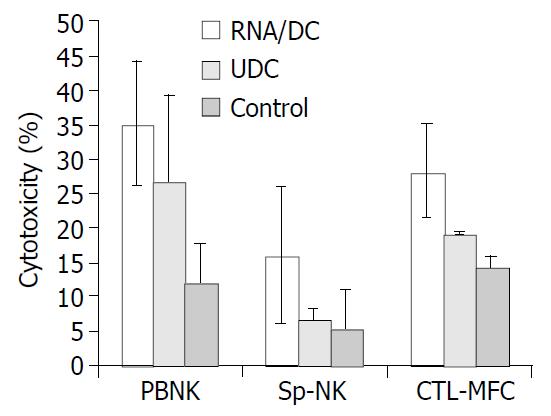
Figure 2 Cytotoxicity of NK cells and CTL.
PBNK: NK cell activity in PBL, Sp-NK: NK cell activity in splenocytes, CTL-MFC: CTL activity to lyses MFC murine gastric cancer cells.
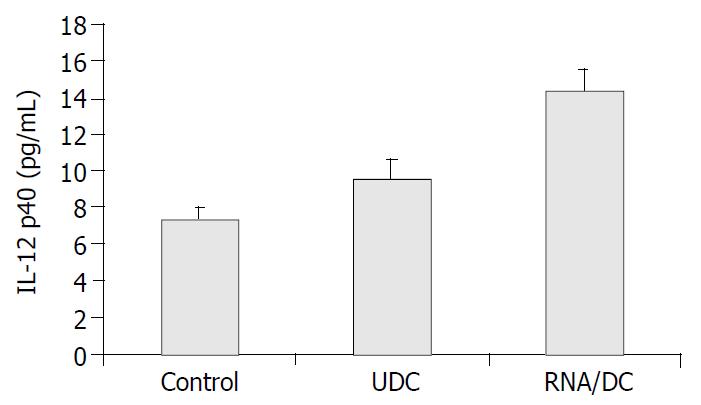
Figure 3 Serum IL-12 p40 levels in three groups of mice three weeks after tumor challenge.
- Citation: Liu BY, Chen XH, Gu QL, Li JF, Yin HR, Zhu ZG, Lin YZ. Antitumor effects of vaccine consisting of dendritic cells pulsed with tumor RNA from gastric cancer. World J Gastroenterol 2004; 10(5): 630-633
- URL: https://www.wjgnet.com/1007-9327/full/v10/i5/630.htm
- DOI: https://dx.doi.org/10.3748/wjg.v10.i5.630


