Copyright
©The Author(s) 2004.
World J Gastroenterol. Dec 15, 2004; 10(24): 3597-3601
Published online Dec 15, 2004. doi: 10.3748/wjg.v10.i24.3597
Published online Dec 15, 2004. doi: 10.3748/wjg.v10.i24.3597
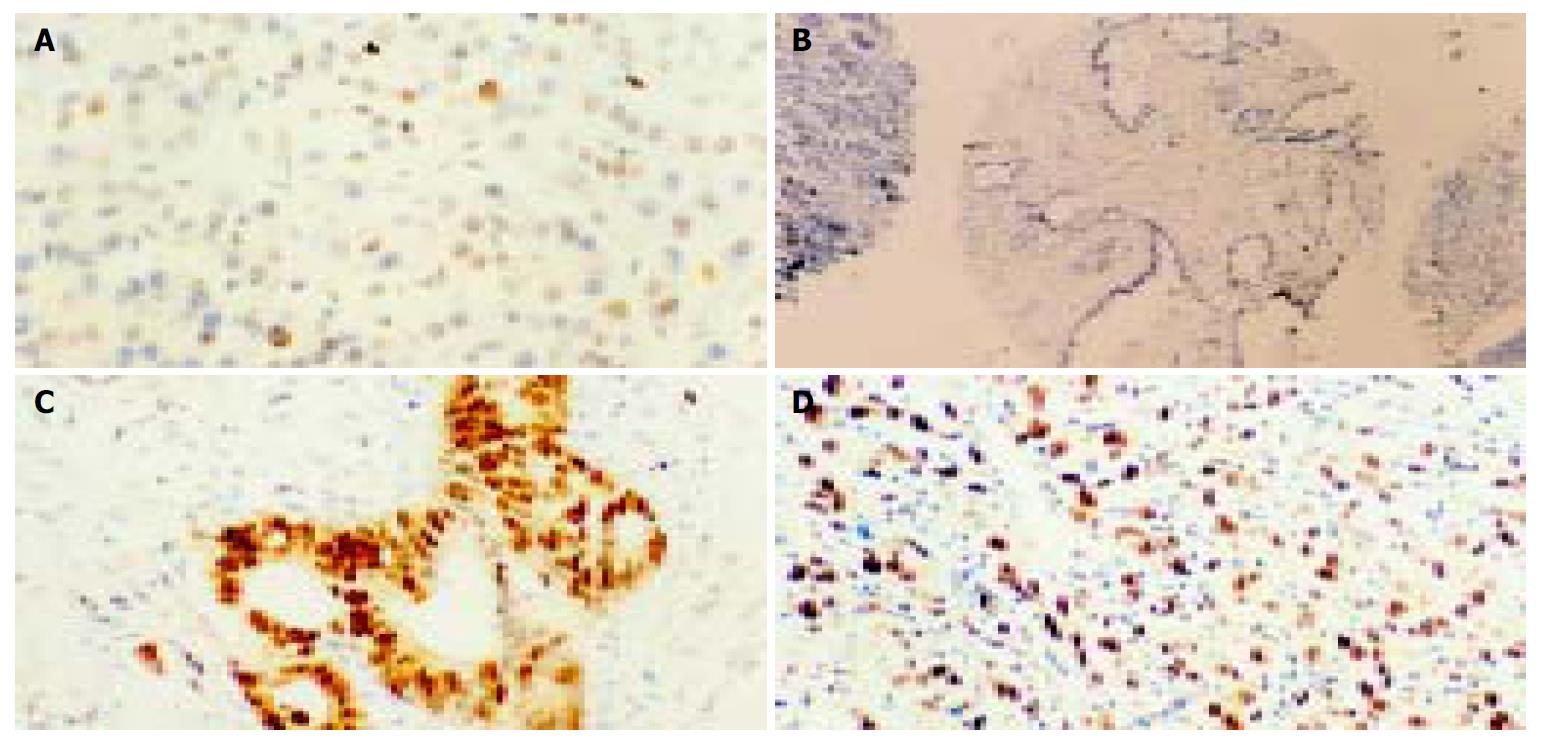
Figure 1 Representative examples of IHC staining for p33ING1b (× 200) on normal pancreatic tissues and cancer tissues.
A: Weak positive pancreatic cells for p33ING1b; B: No p33ING1b; C and D: Extremely strong staining in pancreatic cancer samples.
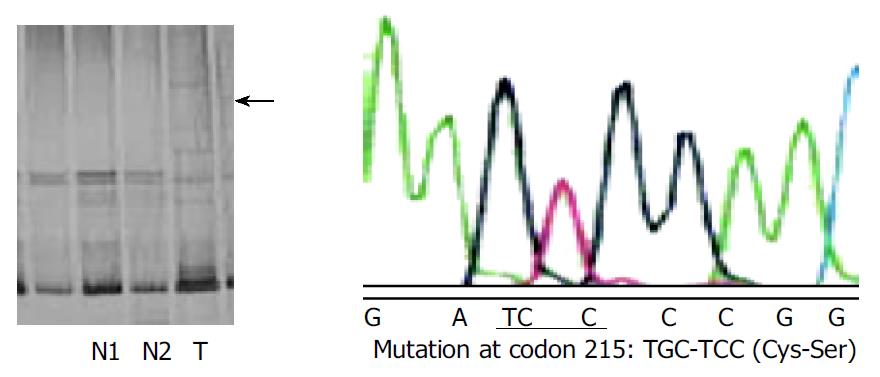
Figure 2 SSCP analysis of p33ING1b gene in genomic DNA from pancreatic carcinomas.
N: normal DNA; T: tumor DNA. Arrow point indicates the altered band in tumor DNA as compared with the corresponding normal DNA. The amino acid substitution of p33ING1b are shown to the right.
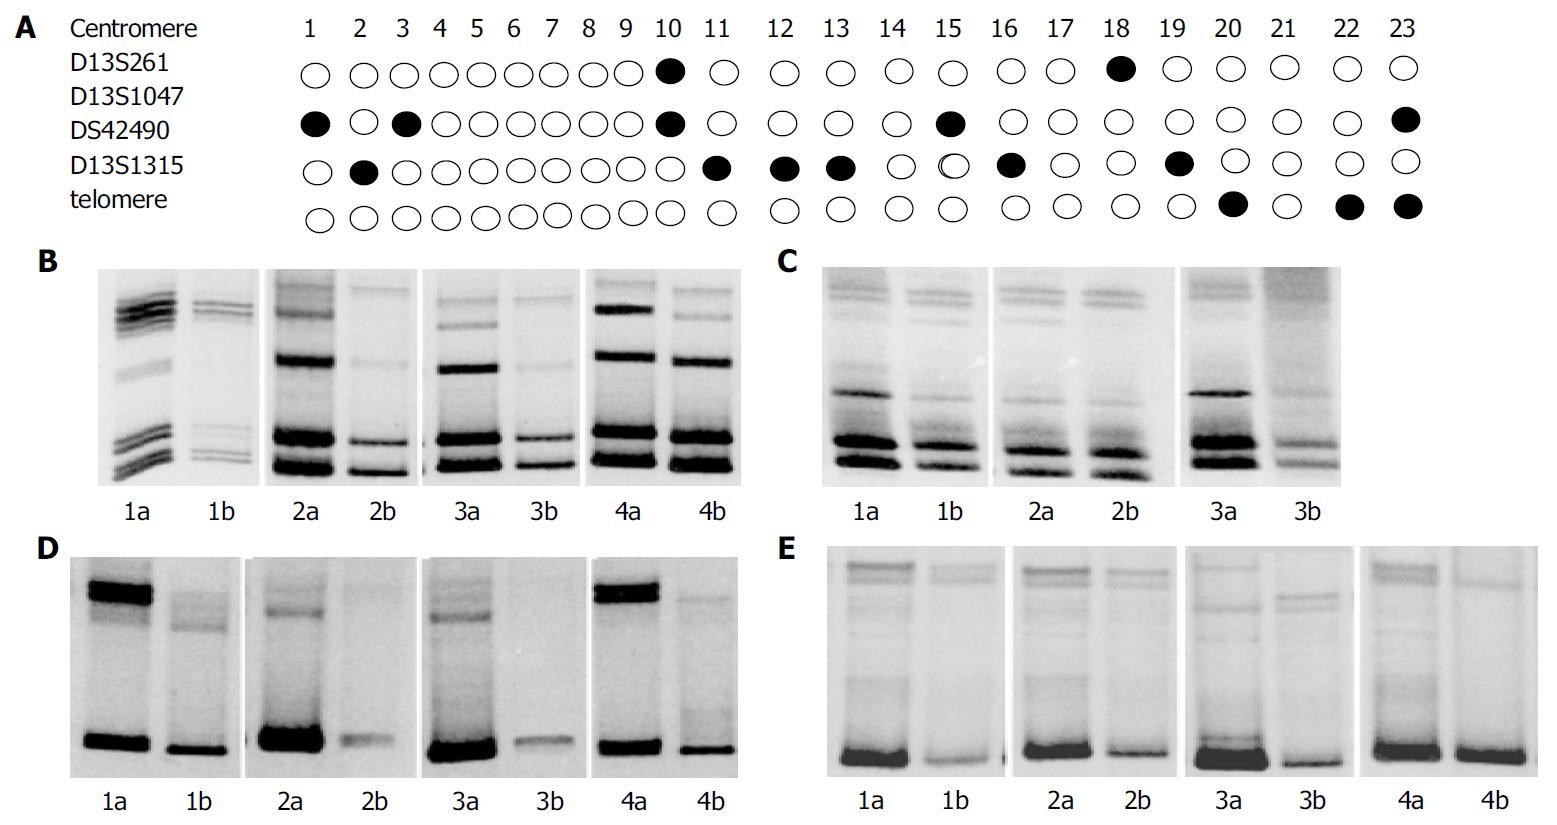
Figure 3 LOH analysis on chromosome 13q33-34 in PCs.
A: Submatic representation of LOH distribution;●LOH○ without LOH; a: cancer; b: matched cancer; B: Analysis of D13S1315; C: LOH analysis of D13S261; D: LOH analysis of DS42490; E: LOH analysis of D13S1047.
- Citation: Yu GZ, Zhu MH, Zhu Z, Ni CR, Zheng JM, Li FM. Genetic alterations and reduced expression of tumor suppressor p33ING1b in human exocrine pancreatic carcinoma. World J Gastroenterol 2004; 10(24): 3597-3601
- URL: https://www.wjgnet.com/1007-9327/full/v10/i24/3597.htm
- DOI: https://dx.doi.org/10.3748/wjg.v10.i24.3597


