Copyright
©The Author(s) 2004.
World J Gastroenterol. Dec 15, 2004; 10(24): 3583-3589
Published online Dec 15, 2004. doi: 10.3748/wjg.v10.i24.3583
Published online Dec 15, 2004. doi: 10.3748/wjg.v10.i24.3583
Figure 1 Expression of p53 protein before (-) and after infec-tion with Ad-p53 (+) in pancreatic cancer cell lines.
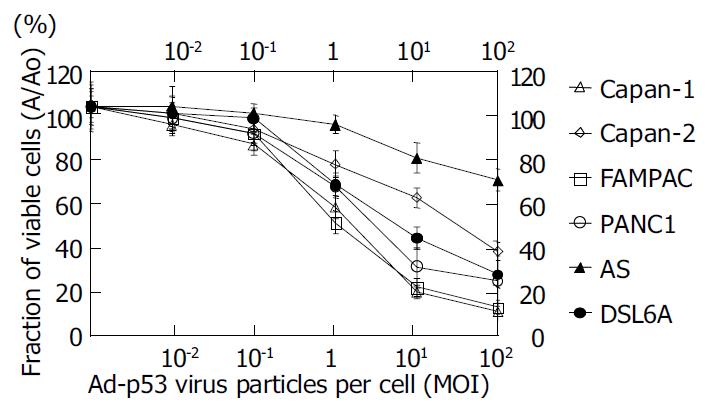
Figure 2 Decreased in vitro growth rate in pancreatic cancer cell lines 24 h after infection with Ad-p53.
Data points repre-sent means from 9 samples of viable cells in three indepen-dent experiments; bars, SD.
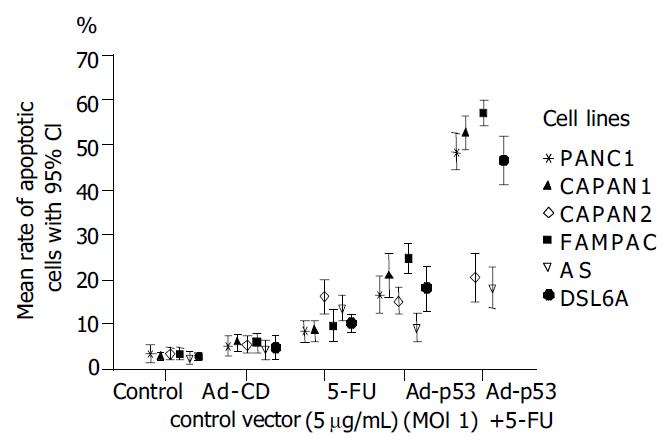
Figure 3 Percentage of apoptotic cells of human and rat pan-creatic carcinoma cell lines either infected with Ad-CD con-trol vector or Ad-p53 (MOI 1) 24 h prior ± 5-FU chemotherapy (5 µg/mL) given for 48 h.
Points represent means from 9 samples in three independent experiments; bars, 95%CI.
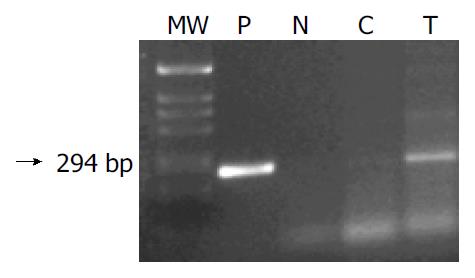
Figure 4 Gel electrophoresis for PCR products from DSL6A tumors removed from Lewis rats 24 h following the last treatment.
(P) positive control, vector DNA; (N) negative con-trol (RT minus control); (C) Ad-CD control virus treated tu-mor (Ad-CD); (T) Ad-p53 infected tumor.
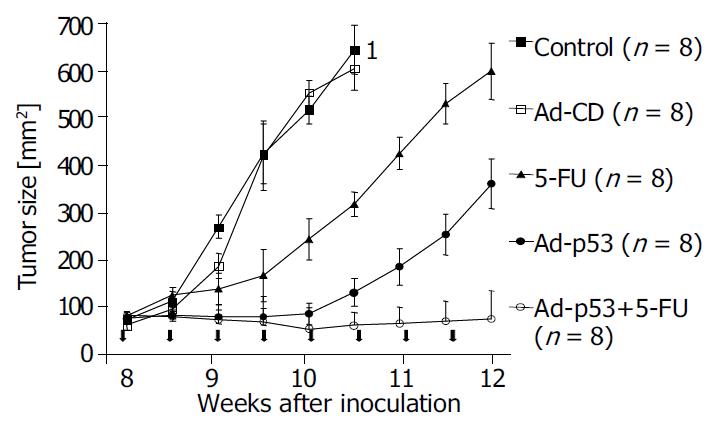
Figure 5 Efficacy of Ad-p53 infection and 5-FU as single agents vs the combination of both on tumor growth of Lewis rats challenged with DSL6A tumor cells.
Arrowheads indicate treat-ment application. 1All animals were killed after 6 cycles of therapy because the tumor size was above 600 mm2.
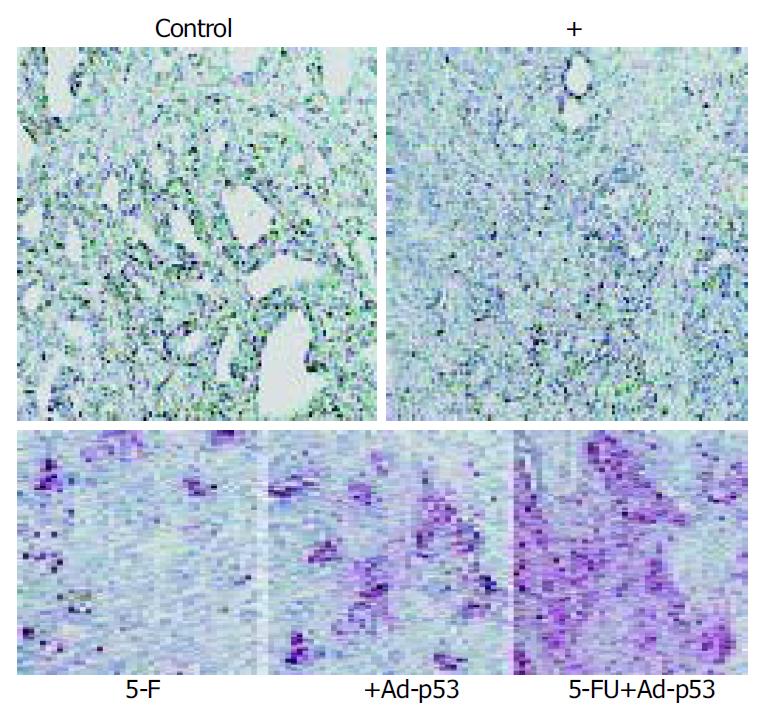
Figure 6 Ad-p53 mediated sensitisation of tumors to apoptosis in response to 5-FU in vivo.
Formalin-fixed tissue sections were analyzed by TUNEL labelling. Original magnification × 200.
- Citation: Eisold S, Linnebacher M, Ryschich E, Antolovic D, Hinz U, Klar E, Schmidt J. The effect of adenovirus expressing wild-type p53 on 5-fluorouracil chemosensitivity is related to p53 status in pancreatic cancer cell lines. World J Gastroenterol 2004; 10(24): 3583-3589
- URL: https://www.wjgnet.com/1007-9327/full/v10/i24/3583.htm
- DOI: https://dx.doi.org/10.3748/wjg.v10.i24.3583


