Copyright
©The Author(s) 2004.
World J Gastroenterol. Dec 15, 2004; 10(24): 3569-3573
Published online Dec 15, 2004. doi: 10.3748/wjg.v10.i24.3569
Published online Dec 15, 2004. doi: 10.3748/wjg.v10.i24.3569
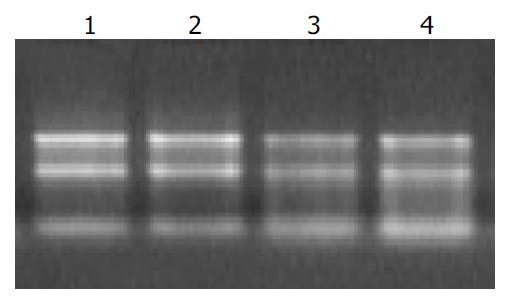
Figure 1 Ethidium bromide-stained 1% agarose gel of four RNA samples.
There were sharp ribosomal bands and mini-mal degradation that was critical for expression analysis. Lanes 1 and 2 represent total RNA derived from SLHCC. Lanes 3 and 4 represent total RNA from NHCC.
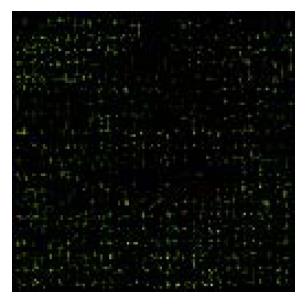
Figure 2 cDNA microarray slide hybridized to SLHCC and NHCC shown before image analysis.
The slide shown was spotted with 8464 genes, hybridized to fluorescence-labeled cDNA, and exposed to scanArray 4000 for image capture. Red spots represent up-regulated genes, green spots represent down-regulated genes in SLHCC compared with NHCC. Yellow spots are related to genes of which gene expression was similar.
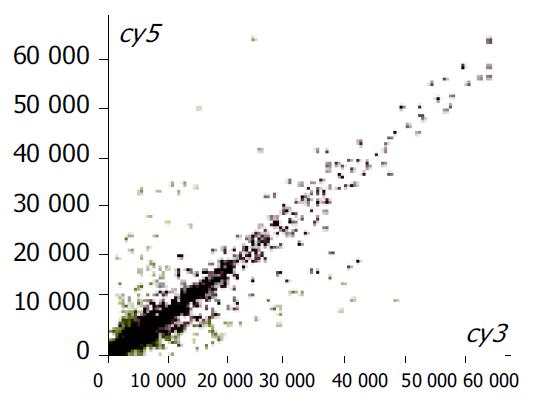
Figure 3 Scatter plot with ImaGene 3.
0 software after hybrid-ization of SLHCC (Cy5)/NHCC (Cy3) (8464 elements). Red spots represent similar expression genes. Yellow spots repre-sent different expression genes.
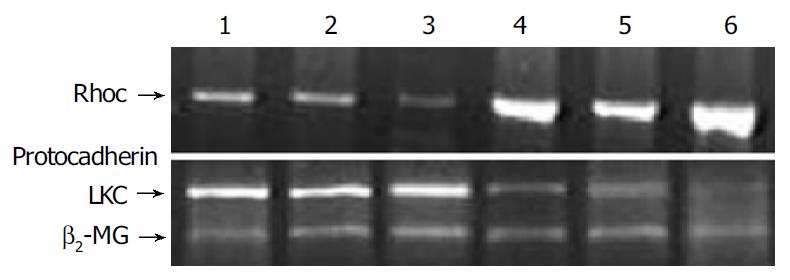
Figure 4 Expression of RhoC and protocadherin LKC mRNA in SLHCC (lanes 1-3) and NHCC (lanes 4-6) SLHCC tissues revealed significantly higher levels of protocadherin LKC mRNA than NHCC and showed significantly lower levels of RhoC mRNA than NHCC.
- Citation: Yang LY, Wang W, Peng JX, Yang JQ, Huang GW. Differentially expressed genes between solitary large hepatocellular carcinoma and nodular hepatocellular carcinoma. World J Gastroenterol 2004; 10(24): 3569-3573
- URL: https://www.wjgnet.com/1007-9327/full/v10/i24/3569.htm
- DOI: https://dx.doi.org/10.3748/wjg.v10.i24.3569


