Copyright
©The Author(s) 2004.
World J Gastroenterol. Dec 1, 2004; 10(23): 3428-3432
Published online Dec 1, 2004. doi: 10.3748/wjg.v10.i23.3428
Published online Dec 1, 2004. doi: 10.3748/wjg.v10.i23.3428
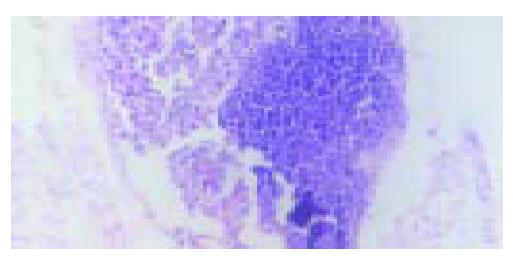
Figure 1 Metastatic H22 tumor in the groin lymph node ( × 100).
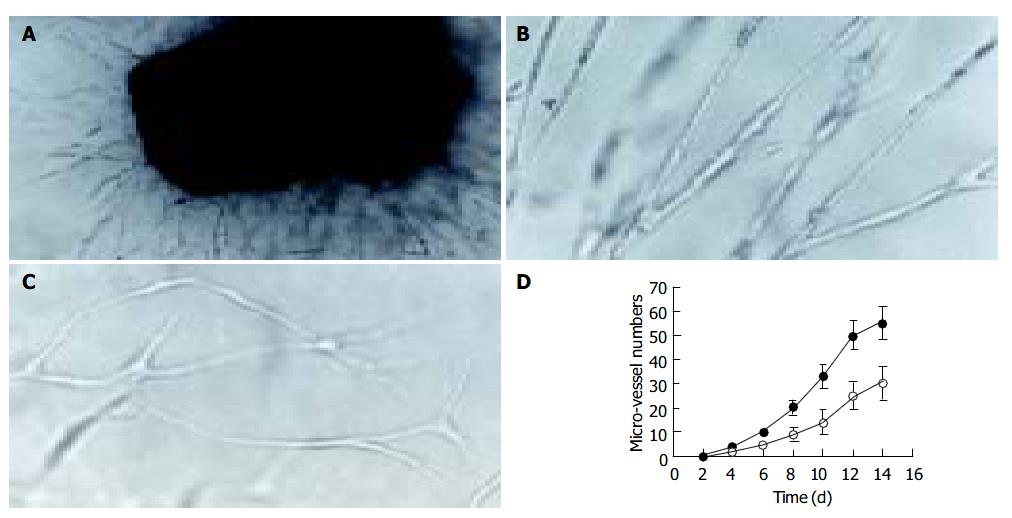
Figure 2 Tri-dimensional culture of lymphangioma.
A: Microphotograph of the capillary network in the fibrin gel ( × 100); B: Straight micro-vessels in H22 CM ( × 200); C: Tortuous micro-vessels in the control medium ( × 200); D: Growth curves of micro-vessels in H22 CM (●) and the control medium (○). Data are expressed as means of 24 samples, and error bars represent SE.
Figure 3 Electron transmission micrographs of the micro-vessel in fibrin gel.
A: Lumen formed by cytoplasmic flaps joined by overlapping contacts ( × 2 000); B: Tight junction complexes between overlapping contacts ( × 10000).
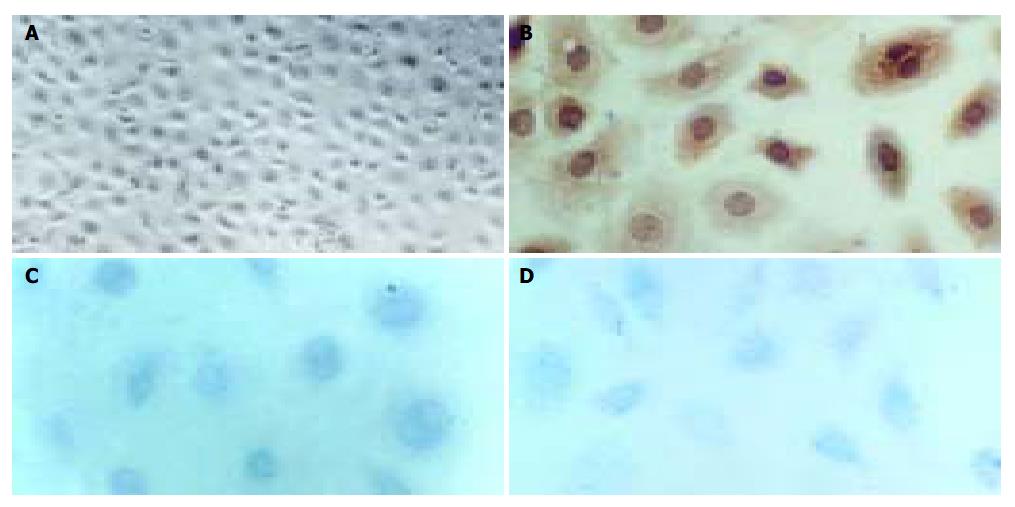
Figure 4 Primary cell culture with H22 CM and immunocytochemical staining.
A: Microphotograph of the confluent cell mono-layer ( × 100); B: Positive staining of Flt-4 (nucleus counterstained with hematoxylin, × 300); C: Positive staining of PCNA ( × 400); D: Positive staining of c-Fos ( × 400).
Figure 5 Expression of iNOS in lymphangioma cells and changes of NO level of the media after incubation.
A: Positive staining of iNOS in cells cultured with H22 CM ( × 400); B: Changes of NO level of the control medium in empty plate (1) or primary culture plate (2), and H22 CM in empty plate (3) or primary culture plate (4).
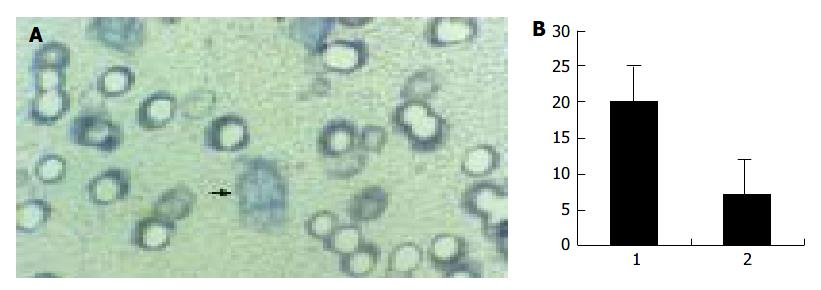
Figure 6 Transwell migration assay.
A: Cells on lower surface of the filter membrane of the Millicell insert ( × 400); B: Migration cell number in H22 CM (1) and the control medium (2).
-
Citation: Yu H, Zhou HZ, Wang CM, Gu XM, Pan BR. Effect of hepatoma H22 on lymphatic endothelium
in vitro . World J Gastroenterol 2004; 10(23): 3428-3432 - URL: https://www.wjgnet.com/1007-9327/full/v10/i23/3428.htm
- DOI: https://dx.doi.org/10.3748/wjg.v10.i23.3428


