Copyright
©The Author(s) 2004.
World J Gastroenterol. Sep 1, 2004; 10(17): 2524-2528
Published online Sep 1, 2004. doi: 10.3748/wjg.v10.i17.2524
Published online Sep 1, 2004. doi: 10.3748/wjg.v10.i17.2524
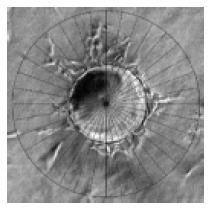
Figure 1 Quantification of angiogenesis.
Each MC in random photographed fields was overlaid with a grid that was equally divided around 360o at 10-degree intervals (original magnification × 100). For each photographed microcarrier, the lengths of sprouts were measured on each of the grid lines and summed. The lengths of sprouts from each MC were averaged in each well. The average lengths of sprouts (ALS) from 8 replicate wells of each testing group were analyzed. Bar: 100 mm.
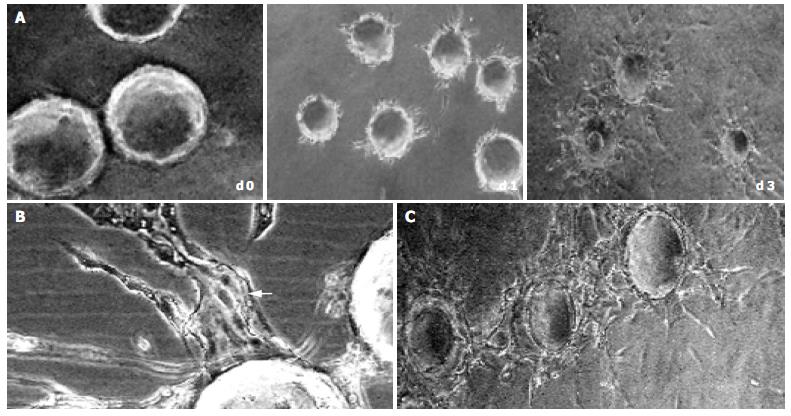
Figure 2 Sequential steps of capillary formation.
During 3 d after polymerization of the fibrin gel, the HMVECs (bFGF 40 ng/mL) on microcarriers migrated into fibrin matrix to form sprouts, which elongated (A) with intracellular or intercellular lumina formed (bFGF 40 ng/mL). The lumina frequently contained cellular debris, which can be seen to float by shaking the culture dishes, indicating that lumina contents had liquefied (B, arrow). In the late stage (d 5), the capillary sprouts anastomosed to each other, and finally formed capillary-like network (C) (original magnification × 100).
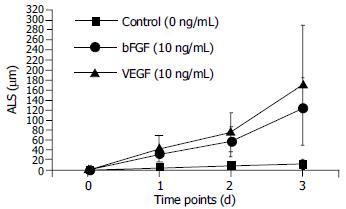
Figure 3 Time course of HMVEC angiogenesis in fibrin.
Microcarriers coated with HMVECs were embedded in fibrin. The angiogenic effects of either bFGF or VEGF were dose-dependent over the range from 10 to 40 ng/mL. At day 1, 10 ng/mL of bFGF and VEGF induced angiogenesis with an ALS of 32.13 ± 16.6 μm and 43.75 ± 27.92 mm, respectively, which were significantly higher than that of the control (5.88 ± 4.45 mm, P < 0.01). The difference became more significant, as the time increased.
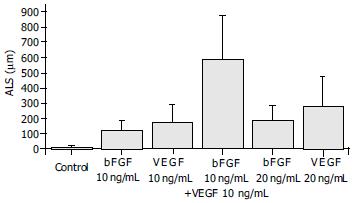
Figure 4 Dose responses of bFGF and VEGF on angiogenesis.
Both bFGF and VEGF exhibited dose-dependent angiogenic effects in the range from 10 to 40 ng/mL. At d 1, 10 ng/mL of bFGF and VEGF induced angiogenesis with an ALS of 32.13 ± 16.6 µm and 43.75 ± 27.92 µm, respectively, which were significantly higher than that of the control (5.88 ± 4.45 µm, P < 0.01). With the concentration increasing, the difference became more significant.
Figure 5 Synergism of bFGF and VEGF.
The samples were quantitated at d 3. The combination of 10 ng/mL bFGF and 10 ng/mL VEGF induced an angiogenic response that was greater than the sum of the effects by each cytokine alone at the same dose (P = 0.011).
-
Citation: Sun XT, Ding YT, Yan XG, Wu LY, Li Q, Cheng N, Qiu YD, Zhang MY. Angiogenic synergistic effect of basic fibroblast growth factor and vascular endothelial growth factor in an
in vitro quantitative microcarrier-based three-dimensional fibrin angiogenesis system. World J Gastroenterol 2004; 10(17): 2524-2528 - URL: https://www.wjgnet.com/1007-9327/full/v10/i17/2524.htm
- DOI: https://dx.doi.org/10.3748/wjg.v10.i17.2524


