Copyright
©The Author(s) 2004.
World J Gastroenterol. Jul 1, 2004; 10(13): 1934-1938
Published online Jul 1, 2004. doi: 10.3748/wjg.v10.i13.1934
Published online Jul 1, 2004. doi: 10.3748/wjg.v10.i13.1934
Figure 1 Bcl-2 expression in sham, IR and IPC groups (× 200).
A: Bcl-2 expression in sham group, B: Bcl-2 expression in IR group, C: Bcl-2 expression in IPC group.
Figure 2 TUNEL staining in sham, IR and IPC groups (× 200).
A: TUNEL staining in sham group, B: TUNEL staining in IR group, C: TUNEL staining in IPC group.
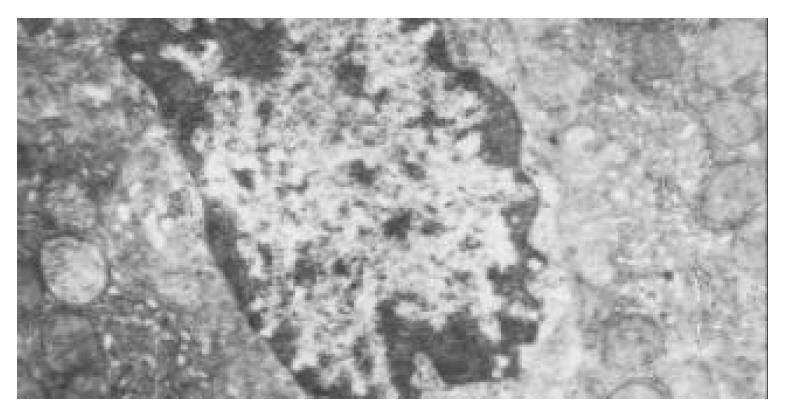
Figure 3 Morphological change of hepatocellular apoptosis in IR group (TEM × 15000).
Figure 4 Mitochondrial ultrastructure in sham, IR and IPC groups (TEM × 15000).
A: Mitochondrial ultrastructure in sham group, B: Mitochondrial ultrastructure in IR group, C: Mitochondrial ultrastructure in IPC group.
- Citation: Sun K, Liu ZS, Sun Q. Role of mitochondria in cell apoptosis during hepatic ischemia-reperfusion injury and protective effect of ischemic postconditioning. World J Gastroenterol 2004; 10(13): 1934-1938
- URL: https://www.wjgnet.com/1007-9327/full/v10/i13/1934.htm
- DOI: https://dx.doi.org/10.3748/wjg.v10.i13.1934


